Only 3 Single Candlesticks Matter: The Bald Big Red Candle, the Buyout Gap-Up Flat Line, and the High-Level Hanging Man
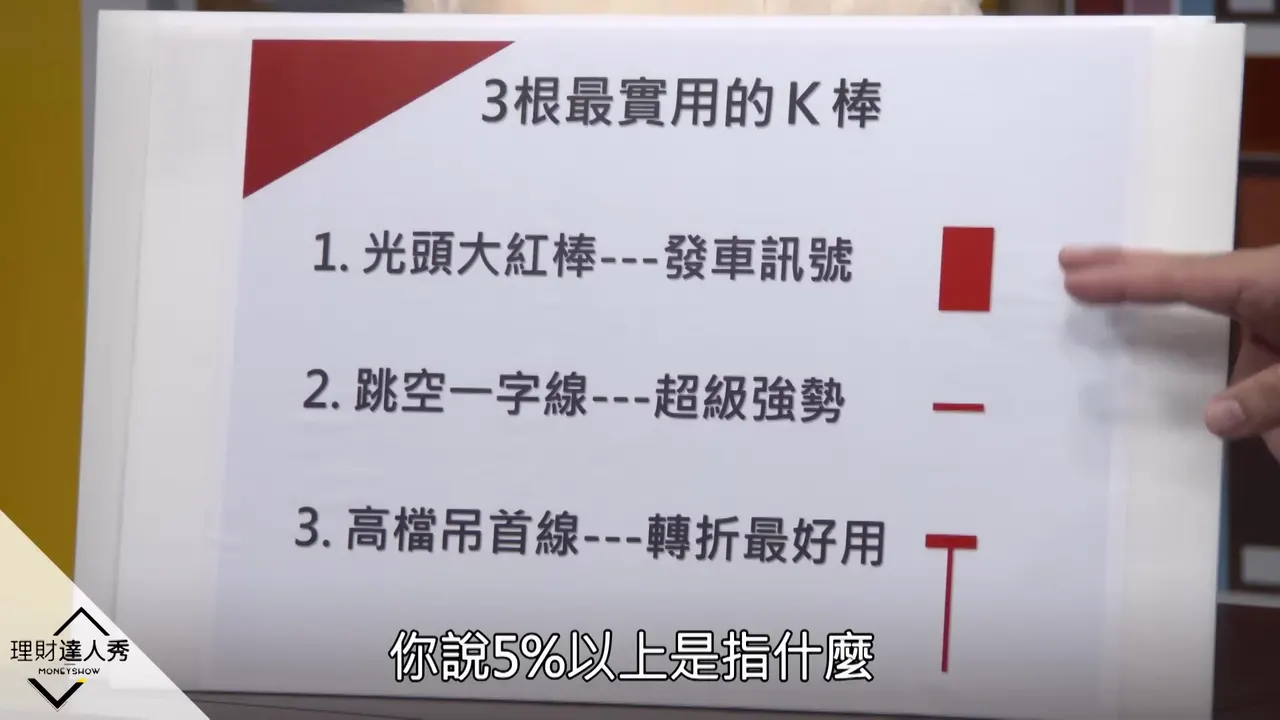
TL;DR: Of the 48 candlestick types, only 3 are worth watching: the bald big red candle, the gap-up flat line, and the high-level hanging man. Some common candles such as the doji are not statistically significant, while these 3 help catch a breakout chase, a buyout limit-up order, and a high-level reversal exit.
Key ideas
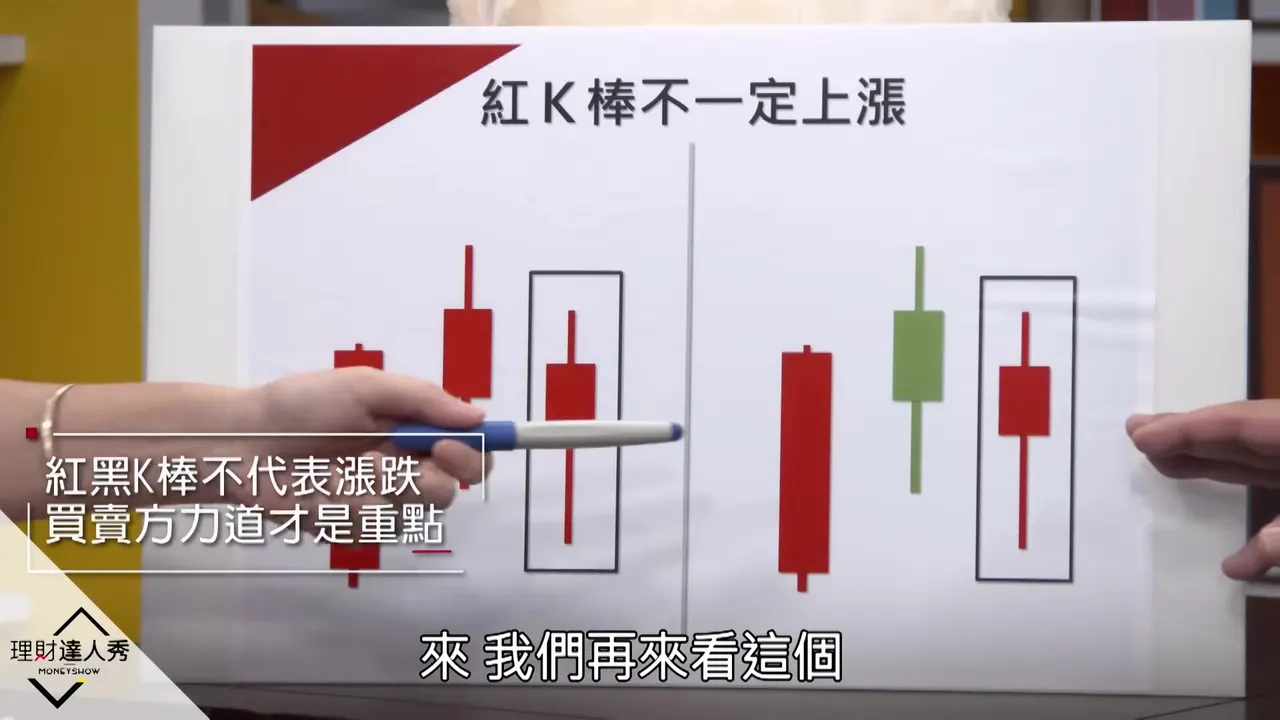
- A red or black candle only says the day opened high and closed lower, or opened low and closed higher; to judge a rise or fall, compare the close with the previous day's close. A red candle usually means major players are more aggressive, but retail buyers lured by finance groups can also push a price up, and that usually ends badly.
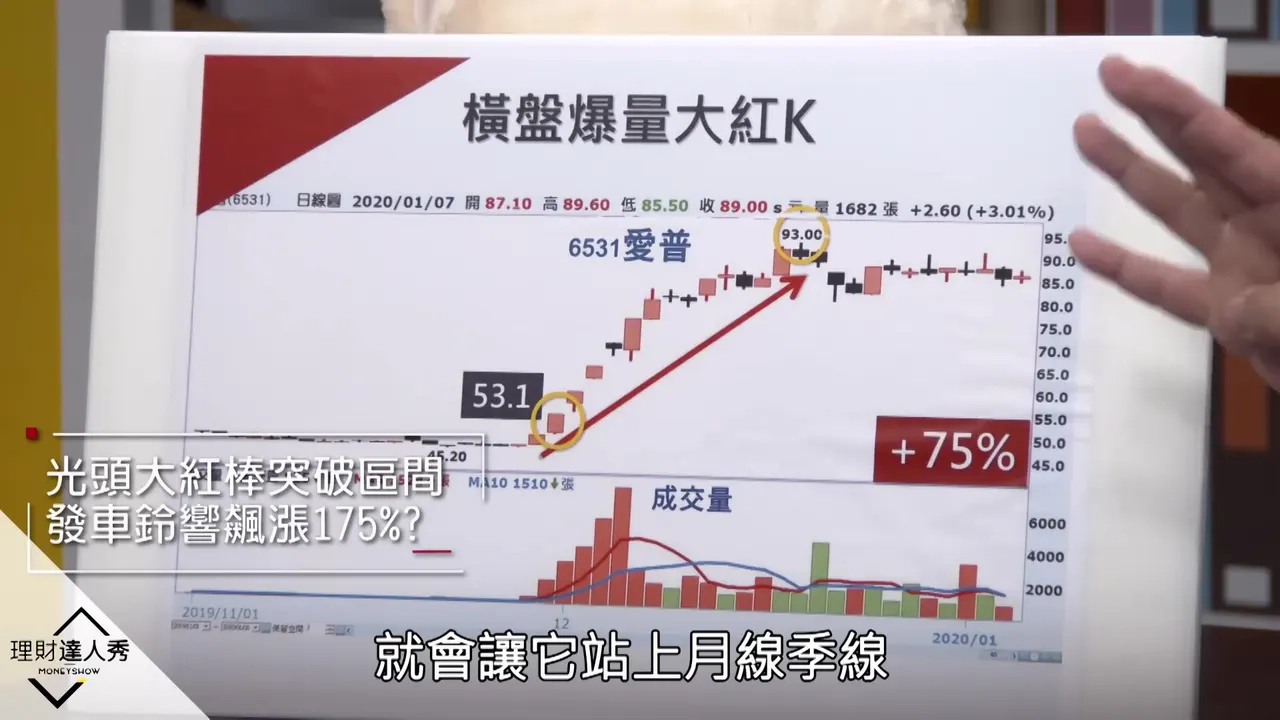
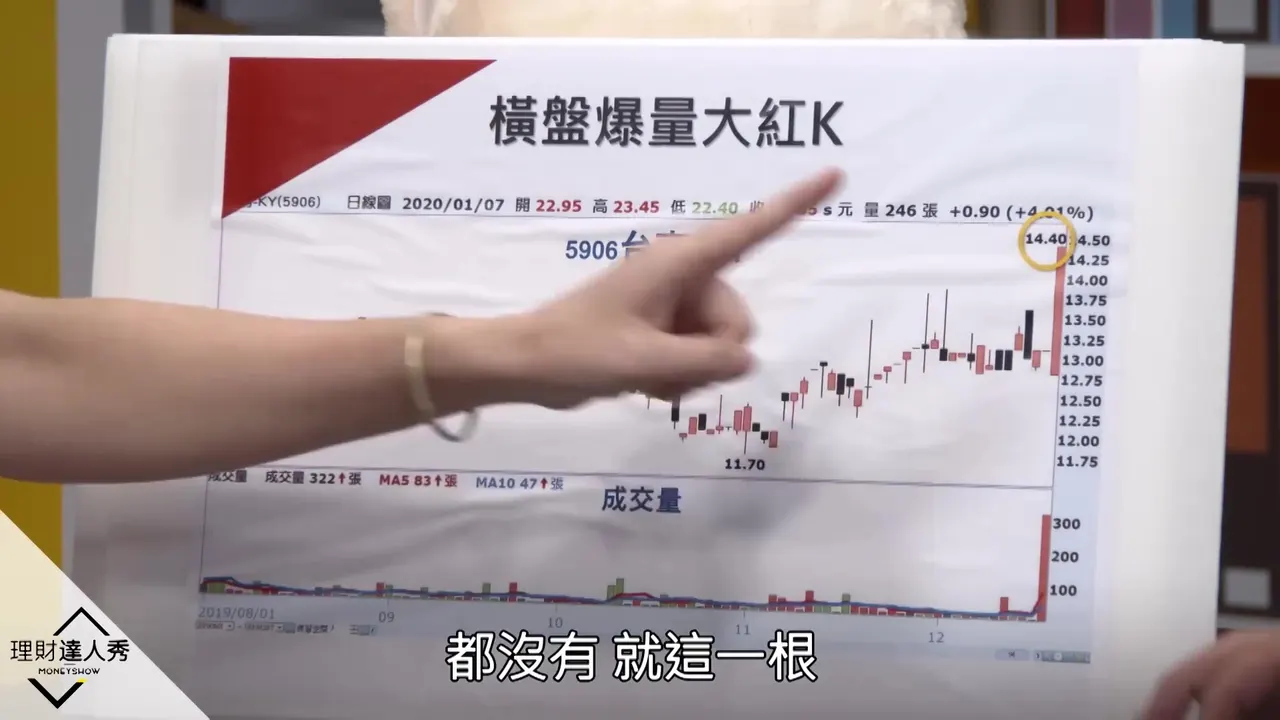
- The key to the bald big red candle is the first limit-up after a long consolidation. The first limit-up often opens and closes repeatedly because trapped holders sell to get out, so there is no need to fear it much. If the stop-loss sits at the lower edge of the consolidation range, it is about 10% away, and one example rose as much as 175%. But chase only the first one at a low level; by the 10th it is too late. The habit of placing sell orders at limit-up and buy orders at limit-down ends up selling at the start of a rally and buying at the start of a drop.
- Do not place orders during the session on a buyout gap-up flat line, because buy orders have already queued up to 190 萬 lots by then. Actually getting filled means someone ahead sold heavily, and the buyout may be fake. Place the order only after confirming at 8:55 pre-market that buy orders exceed 100 萬 lots.
- Buyout trades earn only from the limit-up: sell if it does not lock at limit-up, and treat being filled in full or a volume spike as warning signs. In live trading this earned 20-some % in 3 days.
- The high-level hanging man is a reversal signal with a small body and a long lower shadow. High-level turnover often lands in retail hands, and a crash tends to follow, so exit after it appears following a rally. At a low level it can act like a nail that turns the situation around.
Section summaries
3:05Speaker Introduction and Course Goals
The host introduces Warrant Bro, known for his public trading records. The host also mentions that he was a physics and chemistry teacher for more than 10 years and graduated from a graduate program at National Taiwan Normal University, with a thesis on integrating science writing into optics teaching. The host jokes that someone who teaches science this well should be able to teach personal finance well too.
▶ Watch from here4:50Candlestick Basics: Bullish and Bearish Candles
The topic of this lesson is revealed: the entry-level building block of chip (flow) analysis is the candlestick. It starts with the basics of bullish and bearish candles: a bullish candle closes higher than it opened, while a bearish candle is the opposite. It explains that the upper and lower shadows represent selling pressure and support respectively, and shows how to draw a candlestick from an intraday chart.
▶ Watch from here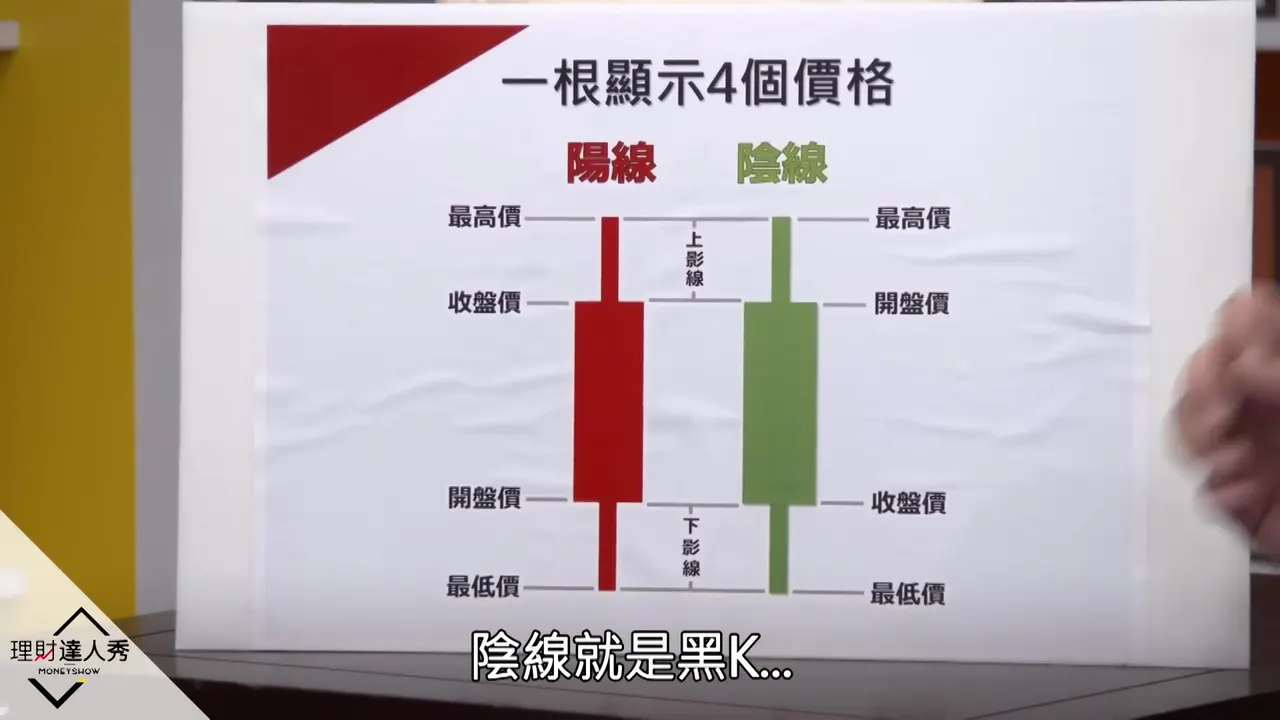
7:50Debunking the Red and Black Candle Myths
This section debunks the myth that a red candle always means a rise and a black candle always means a fall. A candle only reflects whether the day opened high or low and then moved higher; to judge a rise or fall, compare the close with the previous day's close. A worked example reviews that even for the same red candle, comparing where the closes sit before and after tells you whether the price rose or fell.
▶ Watch from here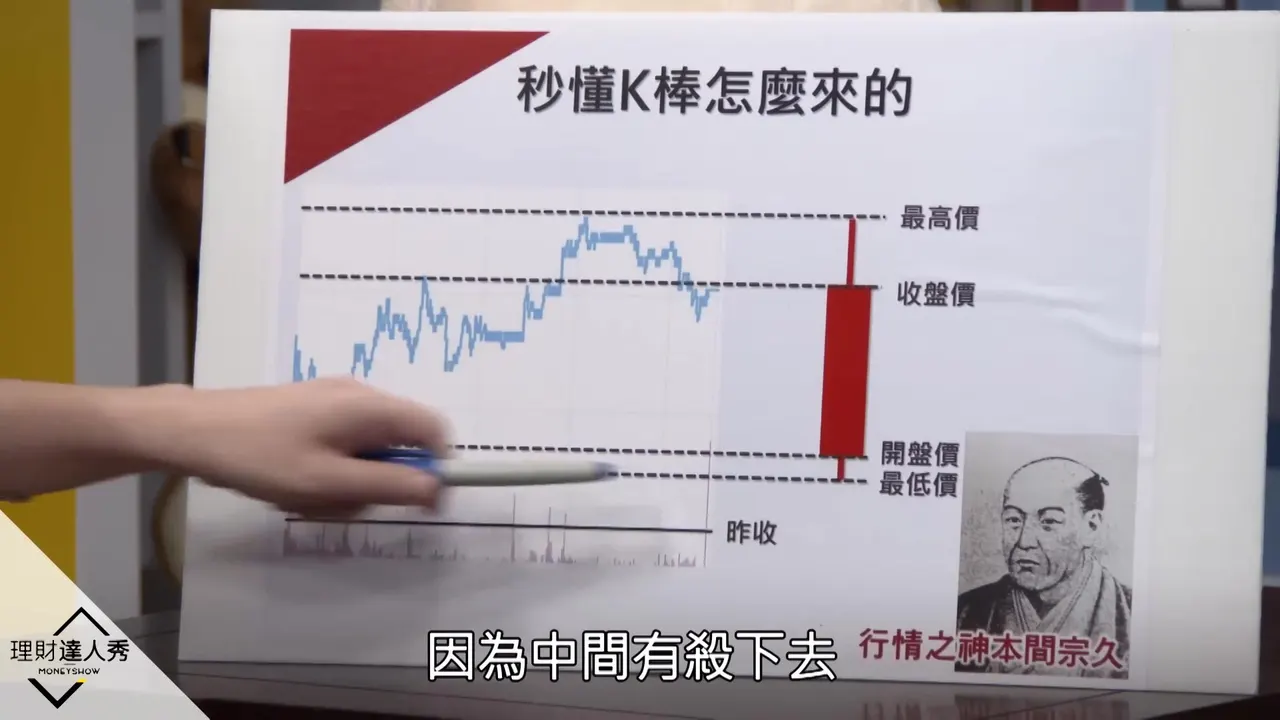
9:25The Buying Force Behind Red Candles
Using the analogy of "only two people left trading," it explains that a red candle means buyers are more aggressive, usually major players buying. The exception is that retail investors lured by finance groups can also push the price up, and that usually ends badly. It previews a later case about a mysterious group.
▶ Watch from here11:40Candlestick Reading Practice and Learning Approach
Viewers are given a question with 4 options to identify a candlestick and answer in the comments. The answer then shows a red candle that opened low, rose, and has a lower shadow, and a black candle that opened high, fell, closed slightly off the low, and has a lower shadow. It stresses that you need not learn all 48 candlestick patterns circulating in the market; for single candles, just master the 3 most practical ones, and combination candlesticks will be taught later.
▶ Watch from here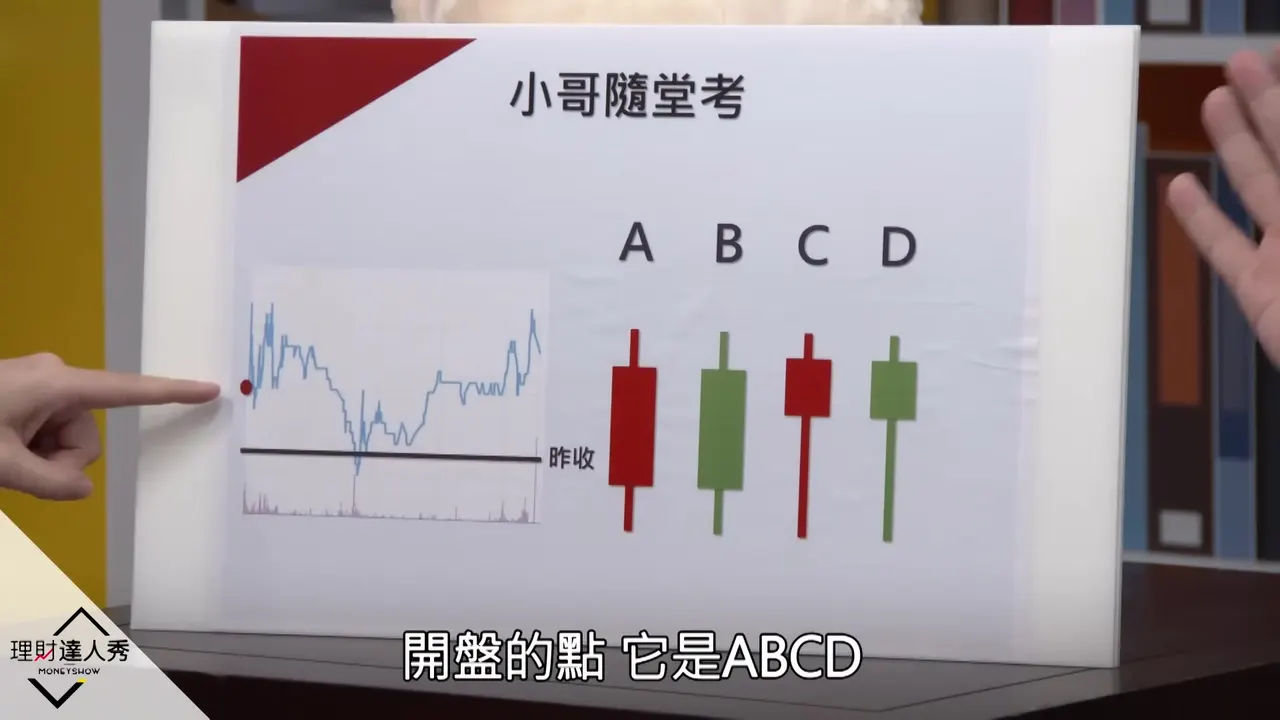
13:15The 3 Most Practical Single Candlesticks
It introduces the 3 most practical single candlesticks: the bald big red candle (at least 5% from the lowest point to the highest point), the gap-up flat line, and the high-level hanging man. Other common candlesticks are not statistically significant, since a reversal does not necessarily follow them, so there is no need to spend time learning them. Combination candlesticks will be taught later.
▶ Watch from here15:10Bald Big Red Candle: The First Limit-Up After Consolidation
Using Systex (系統電) on November 28 as an example, the first limit-up after a long consolidation is actually very low risk. If the stop-loss is set at the lower edge of the consolidation range, it is about 10% away, so chase the first one, but do not chase the later ones (for example the 10th). Retail investors often place sell orders at limit-up and buy orders at limit-down, which easily leads to selling at the start of a rally and buying at the start of a drop.
▶ Watch from here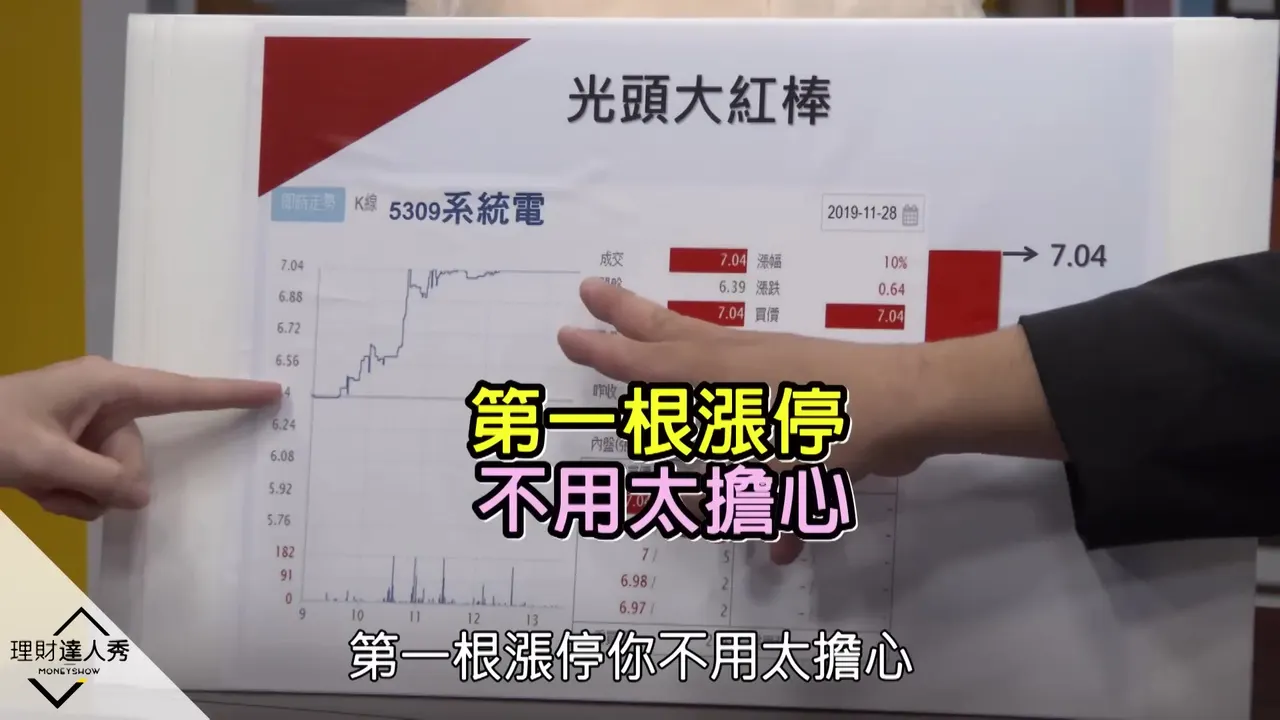
17:45Case Studies: Big Red Candles on Volume After Sideways Trading
Several examples verify that "consolidation plus a big red candle" works best statistically: one case rose 175%, and another went from 53.1 to 93, clearing the monthly and quarterly moving averages at once. Major players wait until the moving averages lie below the price before pushing it up. You can pick stocks in advance and use a touch-price order to chase when the stock is up 9.5%, but only at a low level, not a high one.
▶ Watch from here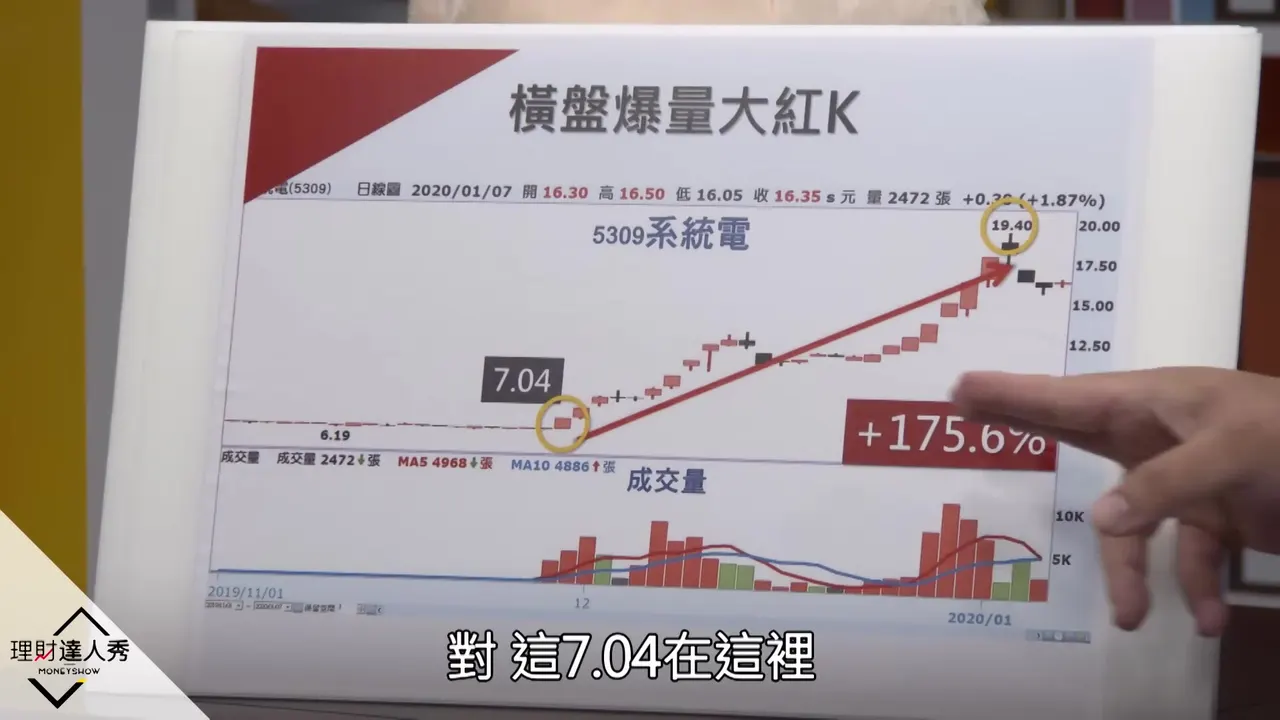
22:05Buyout Gap-Up: Never Place Orders During the Session
With a buyout gap-up flat line there is no chance to enter during the session, and you must never place an order then. At the open, buy orders have already queued up to 190 萬 lots, so placing an order at 9 o'clock is like drawing a queue number past 190 萬. If you actually get filled, it means someone ahead sold more than 100 萬 lots, and the buyout may be fake.
▶ Watch from here24:00Pre-Market Order Technique and Judging Buyouts
The ordering trick is revealed: wedge a toothpick into the keyboard to place the order pre-market, confirm at 8:55 that buy orders exceed 100 萬 lots before placing it, and before 9 o'clock it is all random luck. Of all kinds of bullish news, only a buyout's limit-up is worth grabbing pre-market, because the price is clear. The biggest fear with a buyout is being filled in full, which means too many sell orders and a fake deal; a buyout must not see a volume spike.
▶ Watch from here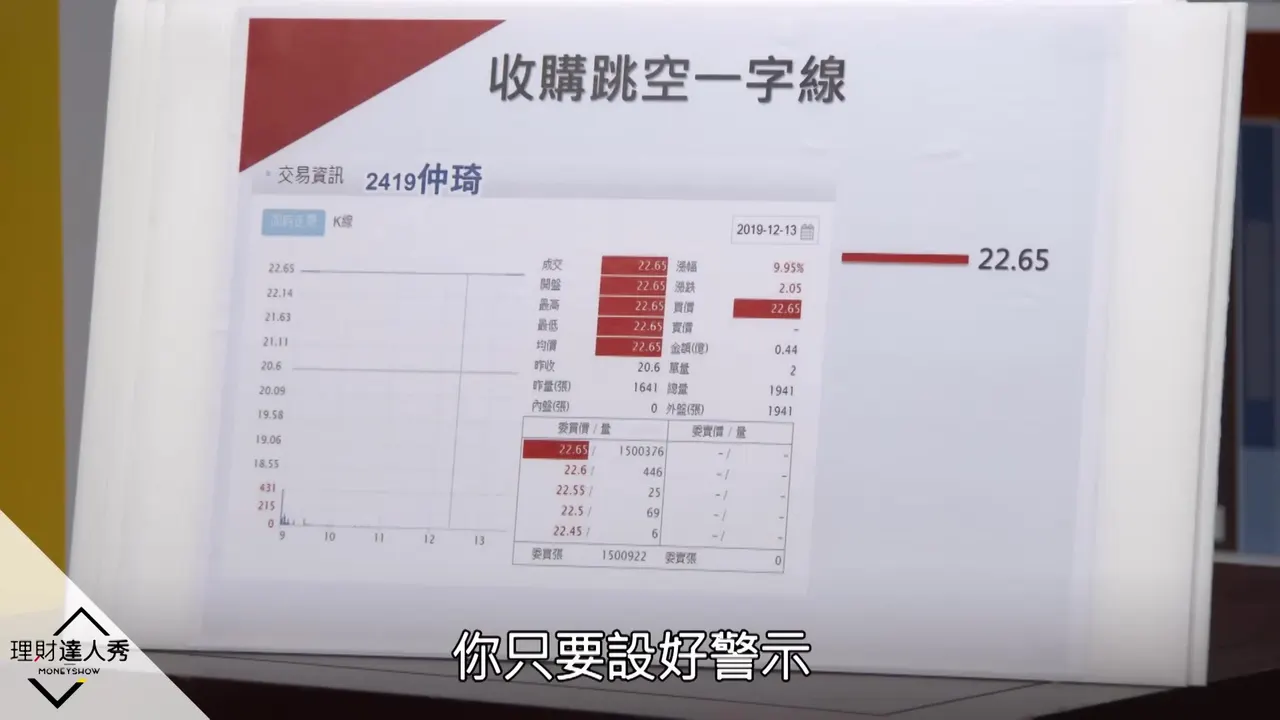
29:50Live Trading the Buyout Flat Line
Warrant Bro shares his own live experience buying a buyout gap-up flat line: he could get filled on days 1 through 3, after the 3rd candle the price is too close to the buyout price and risky, and if it does not lock at limit-up at the open, he always sells. This strategy earned about 20-some % in 3 days; it earns only from the limit-up, and if there is no limit-up, he leaves.
▶ Watch from here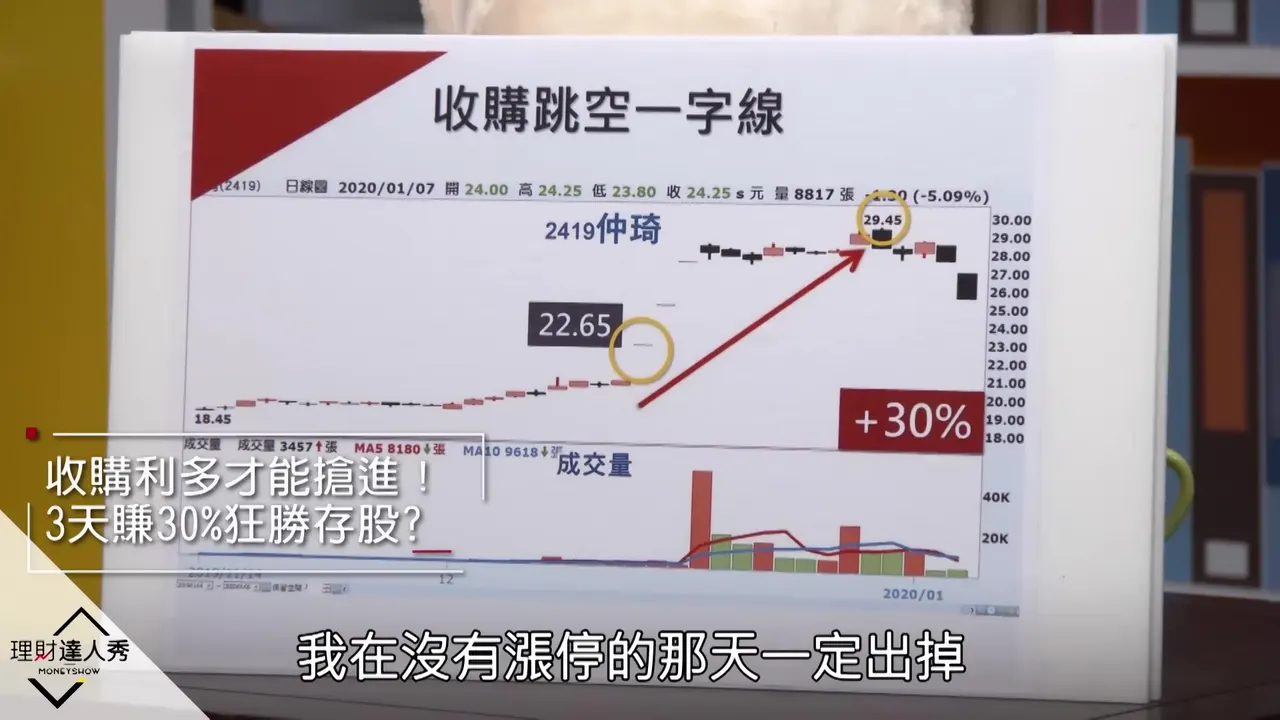
31:35The Wintech Case and the Hanging Man Appears
In the case of Wintech (文曄) being acquired by WPG Holdings (大聯大), he bought on the first candle, and on the second the stock opened high toward the limit-up price of 43.6 but could not lock it, so he sold. Buy orders were about 5–6 萬 lots with each order around 500–600 lots, so fewer than 100 orders could break it open, and in the first buyout you should watch whether the buy-order volume shrinks. It then introduces the third candlestick, the high-level hanging man: a small body, either red or black, and be especially careful when the lower shadow is very long.
▶ Watch from here32:45Hanging Man Signals at High and Low Levels
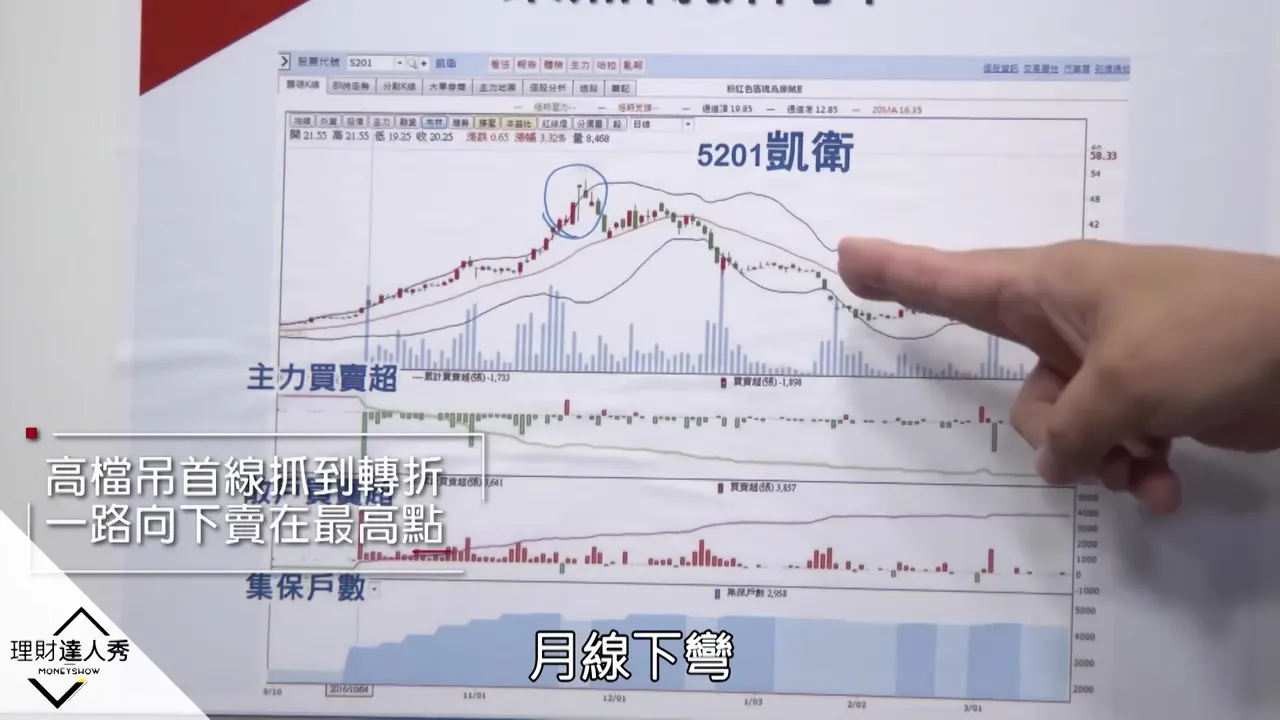
A hanging man at a high level means someone sold the price down and buyers pulled it back, which amounts to high-level turnover. The takers are often retail investors, the chips (share holdings) get worse, and a crash easily follows; a hanging man at a low level is like a nail that can turn the situation around. At either level it is often a signal of change, and Taiwan stocks call for special caution at high levels.
▶ Watch from here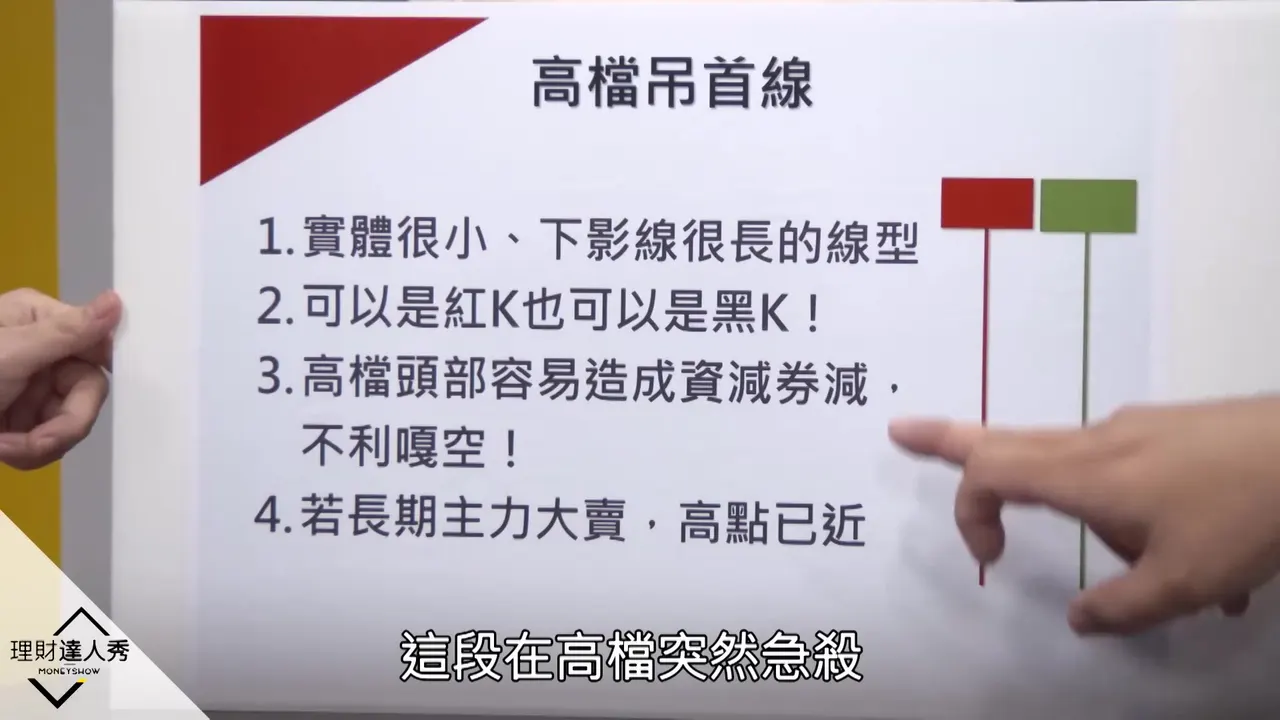
35:10The Kaiwei Case and Course Wrap-Up
Using Kaiwei (凱衛) as an example, major players kept net selling while retail investors got trapped because a finance group told everyone not to sell a single lot, and the hanging man marked the turning point. Counting 20 days afterward, if there is no new high, the monthly moving average turns down and many retail investors are force-liquidated. The conclusion is that a hanging man after a rally means momentum is spent, so exit first.
▶ Watch from here