Using Bollinger Band Width and Slope to Pick Stocks, Then Confirming Entries and Exits with Major-Player Net Buying and Selling
TL;DR: Check Bollinger Band width first (upper band divided by lower band, minus 1): chase only when the width is narrow and the upper band tilts up 1% or more, and sell once price leaves the upper band; when the width is wide, let major-player net buying or selling decide between going long at the lower band or shorting at the upper band.
Key ideas
- Bollinger Bands are the middle band (20-day moving average) plus and minus 2 standard deviations, so price stays inside the bands about 95% of the time; the common advice to buy above the monthly line and sell below it keeps hitting stop-losses in a sideways market, so stay out during consolidation and buy only once the upper band tilts up (the bands "open").
- Band width = upper band divided by lower band, minus 1. The Taiwan market average is about 10%; under 5% is very narrow and over 20% is very wide. FamilyMart's width is only 1.4% while Duokang-DR's is as high as 53%, so the two are traded completely differently.
- With a narrow width, look at the slope of the upper band, always in percentage terms and never in degrees: 1% counts as tilting up and 3% or more is very strong; hold while price rides the upper band, sell as soon as it leaves, and you may take partial profits. Yaguang's bands opened at a width of about 5.4%, and the stock rose from the 80s to 105.
- With a wide width, watch the major players: when they are net buyers, the lower band is a buy-the-dip point, and when they are net sellers, a rise to the upper band is a selling point for them to unload; this differs from the narrow-width idea of selling when the lower band turns down, so do not confuse the two.
- Every Bollinger approach should be paired with major-player net buying and selling: if the major players are selling, stay away even when the bands open; a stock that stays between the upper band and the monthly line without breaking below the monthly line is an uptrend you can hold comfortably.
Section summaries
11:45Course Introduction and Bollinger Band Basics
Stock picking is compared to a claw machine: the claw must be strong and the barrier low, which for stocks means the chip flow (who is buying) must have force and the Bollinger band width must be narrow, so that price can show its direction easily. Bollinger Bands have 3 lines: the middle band is the 20-day simple moving average (the monthly line) and the upper band is the middle band plus 2 standard deviations, forming the basis for the stock-selection lessons that follow.
▶ Watch from here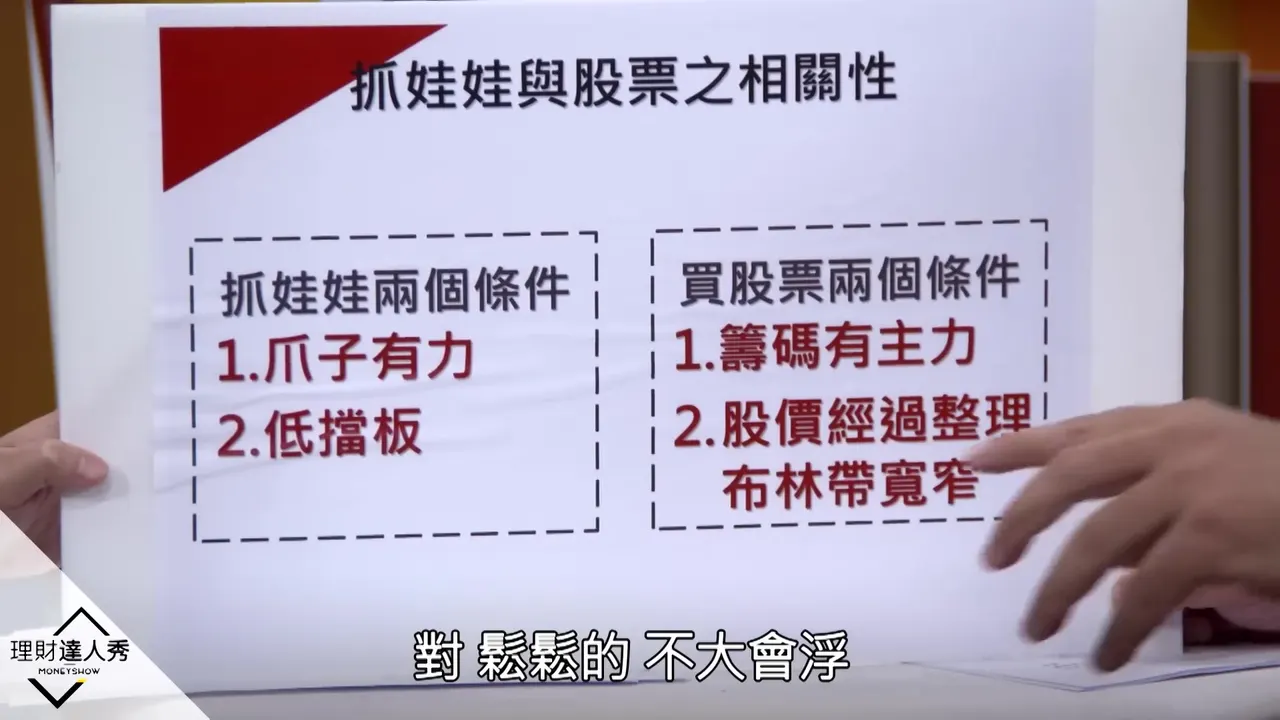
14:11Two Standard Deviations and a Common Myth
2 standard deviations is roughly a 95% probability, so price should stay inside the channel between the upper and lower bands. Popular advice often teaches only "buy when price gets above the monthly line, sell when it falls below," but in a sideways market that keeps triggering stop-losses and the fees eat you alive, so do not enter during consolidation.
▶ Watch from here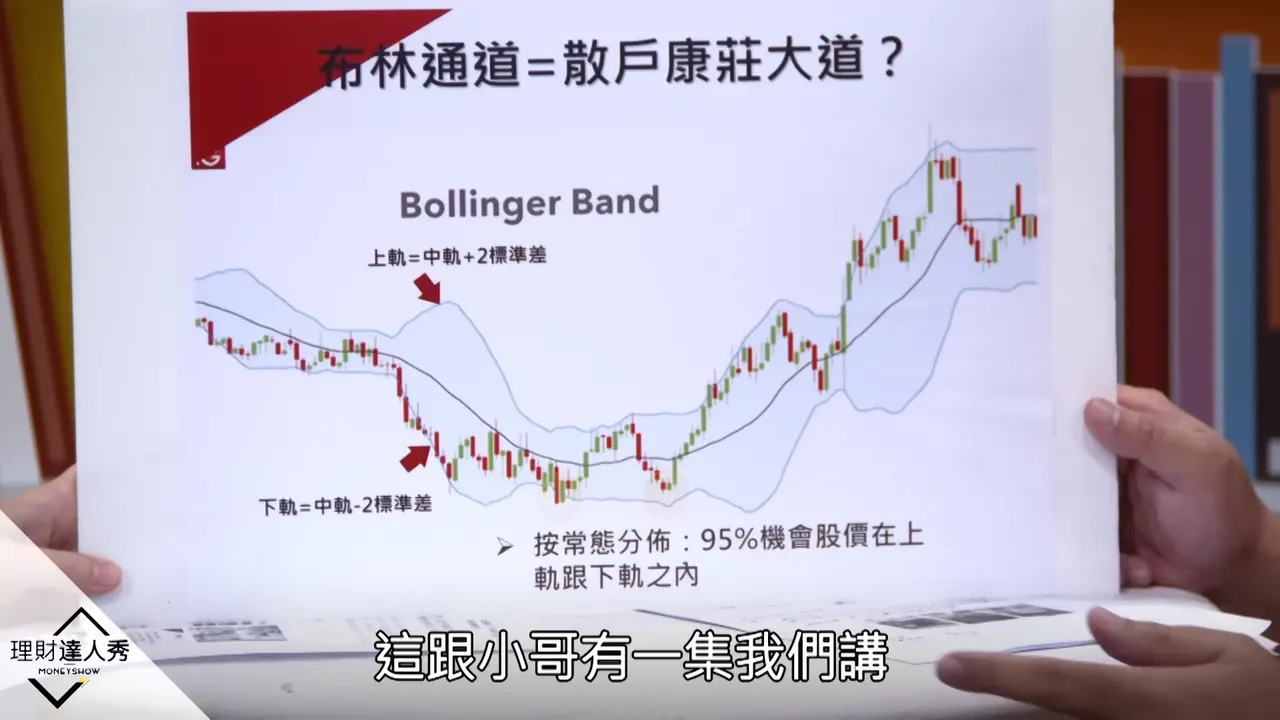
15:56Band Width Definition and Slope in Percentage
One example: the channel top is 30.9 and the channel bottom is 29.9, and price hangs around between these 2 lines for a long time, so the width is only about 3%; commissions and transaction tax alone would cost 0.6%, so it is not worth entering, and you wait for the upper band to tilt up before chasing. Slope is always defined as a percentage, because angles change with chart scaling: the same monthly line stretched out may look like only 20 degrees, yet shrunk it becomes 50 degrees.
▶ Watch from here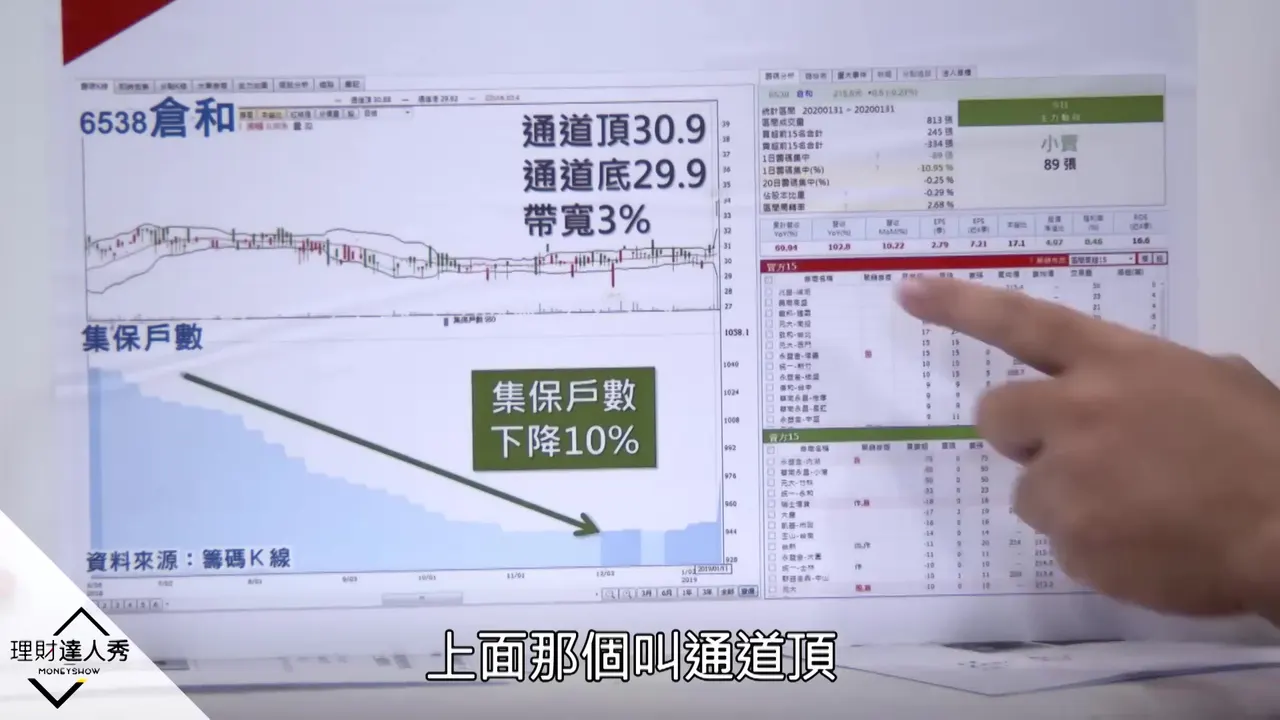
18:01Conclusion on the Bollinger-Open Buy Point
Ignore the stock entirely during consolidation, and buy when the upper band tilts up (called "opening the Bollinger"), which lets you buy at a very low point. The conclusion is simple: an upper band tilting up is a good buy point, ideally with the major-player net buying and selling indicator below also tilting up.
▶ Watch from here
18:26Band Breakout Trading Method
The first method is breaking out of the upper or lower band: buy when the upper band tilts up and sell when it bends down. Whether a breakout succeeds depends mainly on the band width: a very narrow width breaks out easily, while a very wide one swings within the range, so there are two ways to play. How to calculate the width and how much tilt counts as tilting are defined separately later.
▶ Watch from here
19:11Band Width Formula and Wide/Narrow Standards
Band width is the key to Bollinger Bands, and the host's definition is the simplest: upper band divided by lower band, minus 1. For example, with a lower band of 100 and an upper band of 110, the width is 10%. The Taiwan market average is about 10%; under 5% is very narrow and suited to breakout trades, while over 20% is very wide and suited to range trading. FamilyMart (5903) is an example of a very narrow one.
▶ Watch from here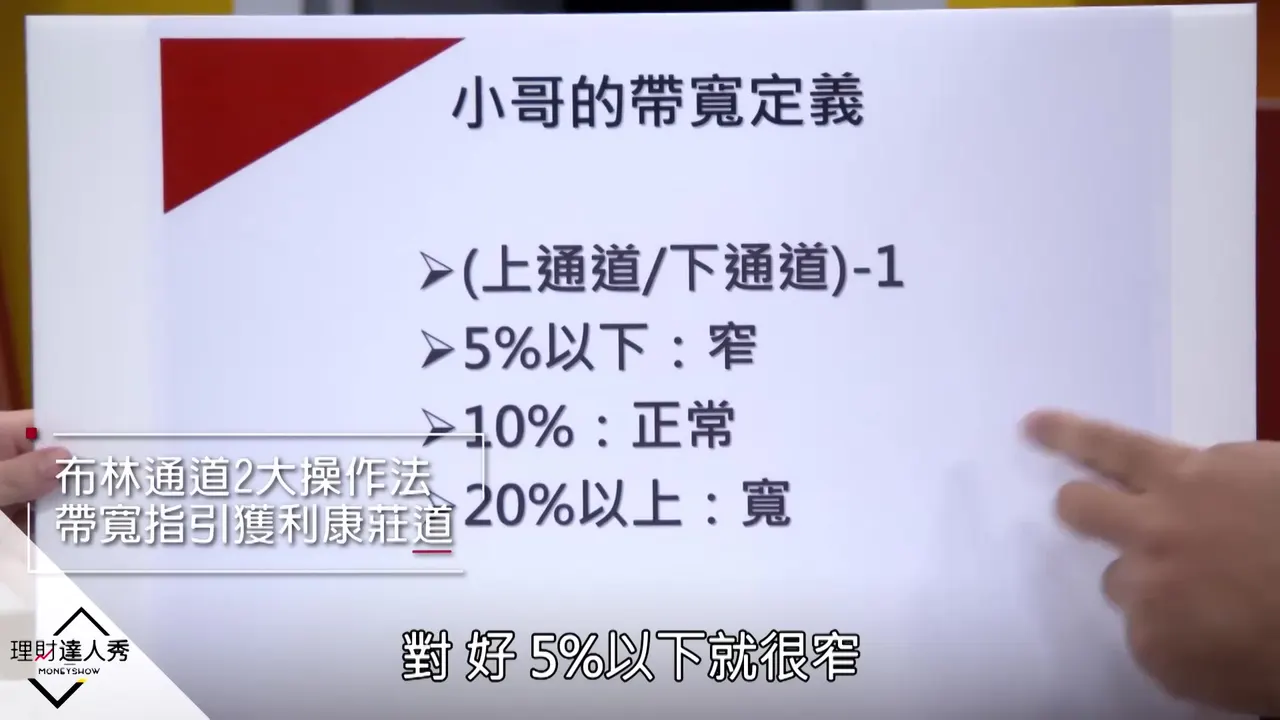
21:16Narrow vs. Wide Width Examples (FamilyMart, Duokang-DR)
FamilyMart's upper band is 220 and its lower band is 217, only 3 apart, so the width is only 1.4%, extremely narrow; it hangs between 217 and 220 every day, which is fine for buy-and-hold but too boring for trading price swings. By contrast, Duokang-DR has a channel bottom of 0.97 and a channel top of 1.48, a width as high as 53%; with swings that large and a big drop already, it does not break out easily. The two hosts also used waist size as an analogy for wide and narrow widths.
▶ Watch from here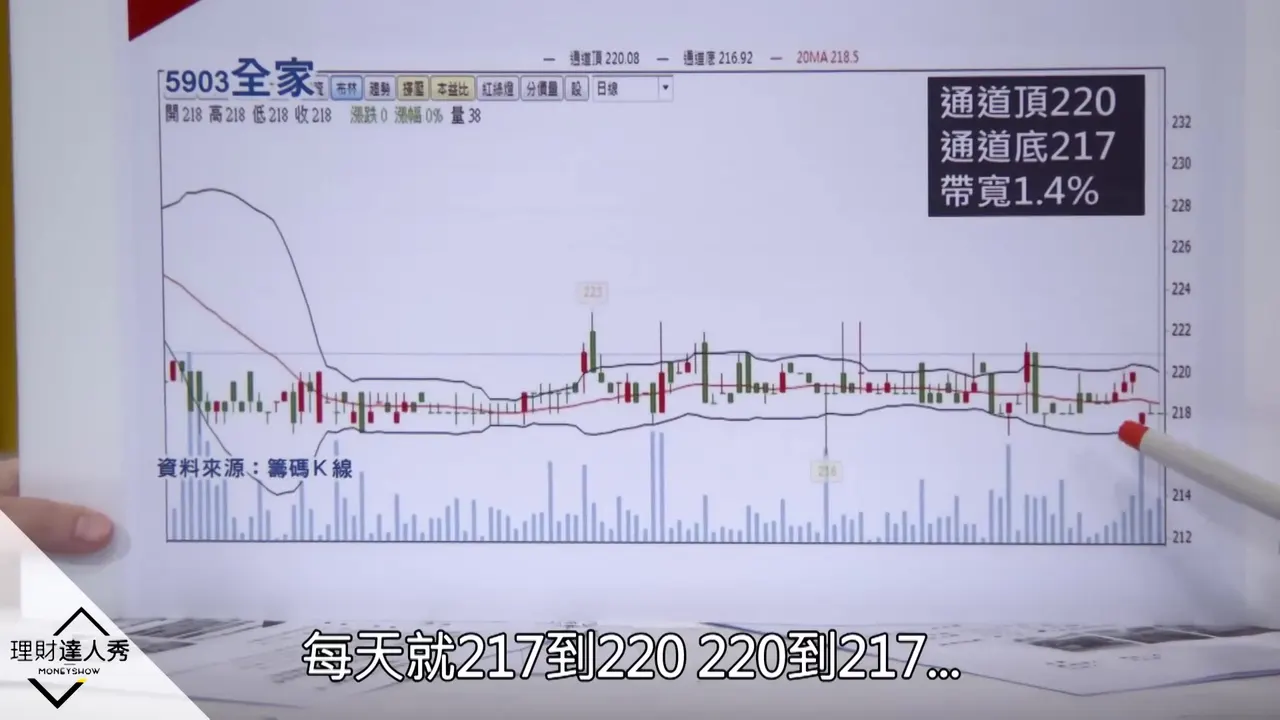
22:55Buy and Sell Points for a Narrow, Diverging Band
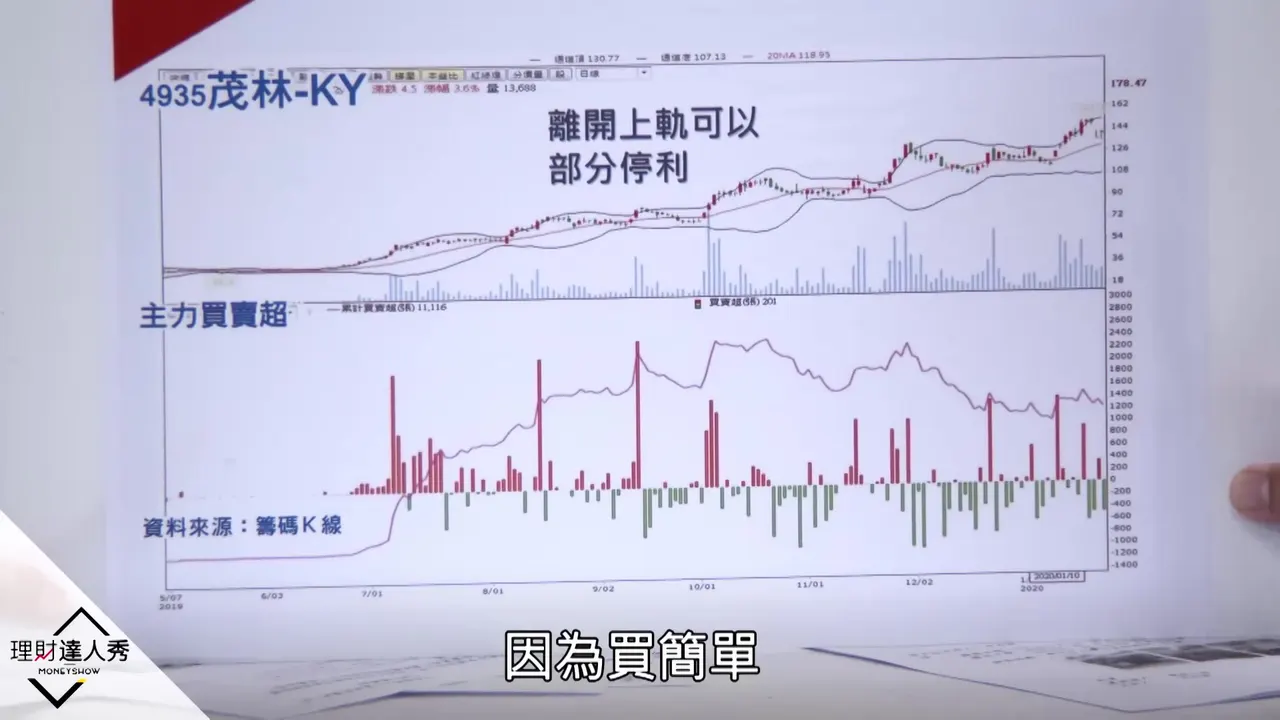
When the width is narrow and the bands diverge upward, near the upper band is a good buy point. The selling principle: do not sell while price sticks along the upper band, and sell as soon as it leaves; on leaving you may take partial profits and keep a few lots for the long term. For short-term trading, buy on a breakout once the channel has narrowed, and sell when price leaves the upper band.
▶ Watch from here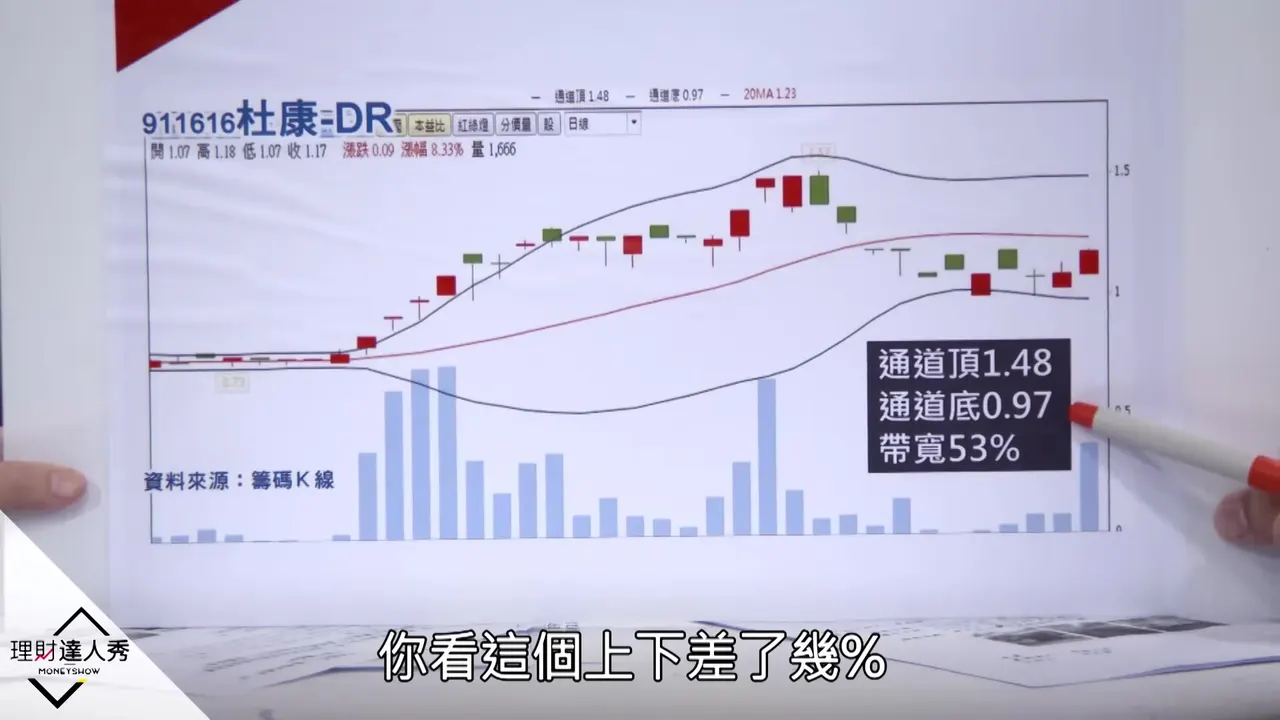
24:52Breakout Buying Confirmed by Chip Flow
Another strong stock is handled the same way: buy when the band tilts up, sell as soon as price leaves the upper band, and repeat. The major players in this stock were not buying heavily but were both buying and selling; you need to read it together with chip flow, and if the major players keep selling, stay away even if the Bollinger opens.
▶ Watch from here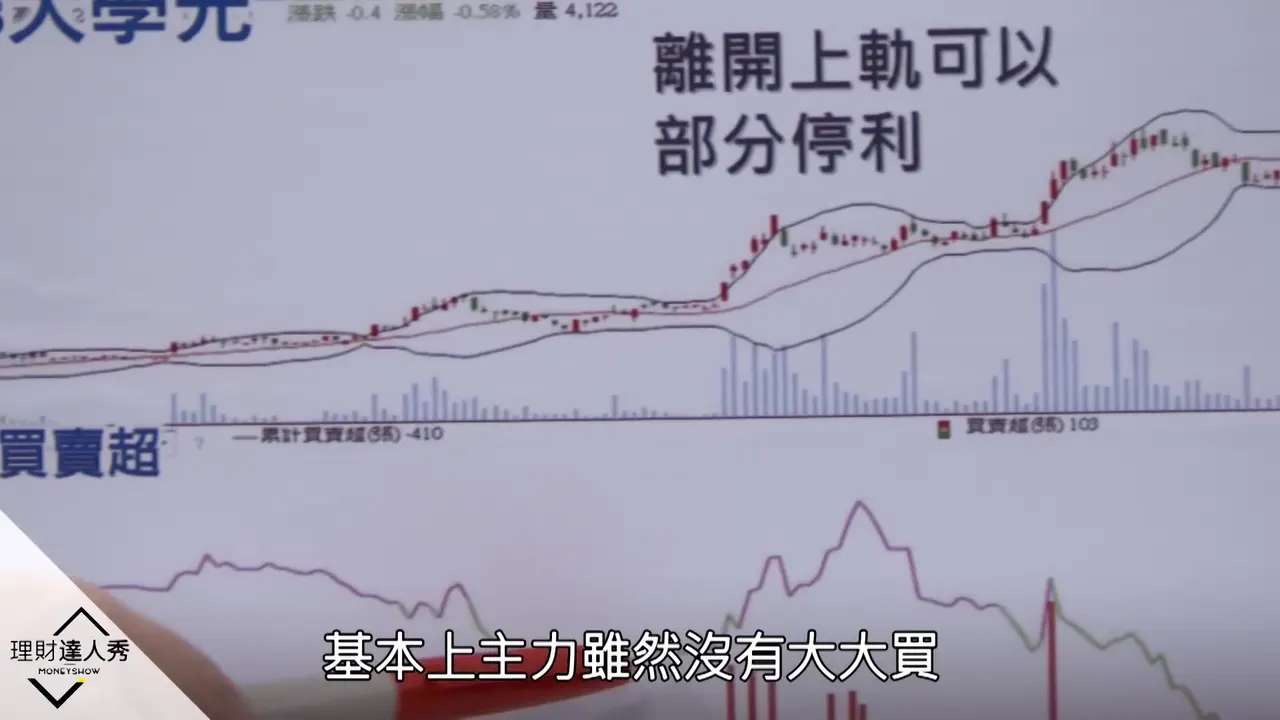
26:07Yaguang Stock Observation and Key Broker Branches
Yaguang holds its year-end party (a New Year gathering) in early January every year, and the boss often says good things about the company to motivate people, so the stock price often reacts first in December, which is why the host pays special attention. As for the key broker branch, because the show has high ratings, the major players move away as soon as it is mentioned, so it is not disclosed; the only hint is that the key branch bought first and the major players were net buyers. Before the Bollinger opened, the width was about 5.4%, which fits a narrow width.
▶ Watch from here27:47Slope Strength Standards and the Yaguang Example
Slope is judged not by angle but by the percentage change in the upper band's price. For example, the upper band rising from 83.1 to 84.7 is a 1.9% gain; a 1% slope counts as tilting up, 3% or more is very strong, and 10% is extremely strong. Yaguang's upper-band slope later reached 3.2% and then 4.1%, very strong. With a very narrow width and an upward slope, you hold until price leaves the upper band and then sell, and the stock rose from the 80s to 105.
▶ Watch from here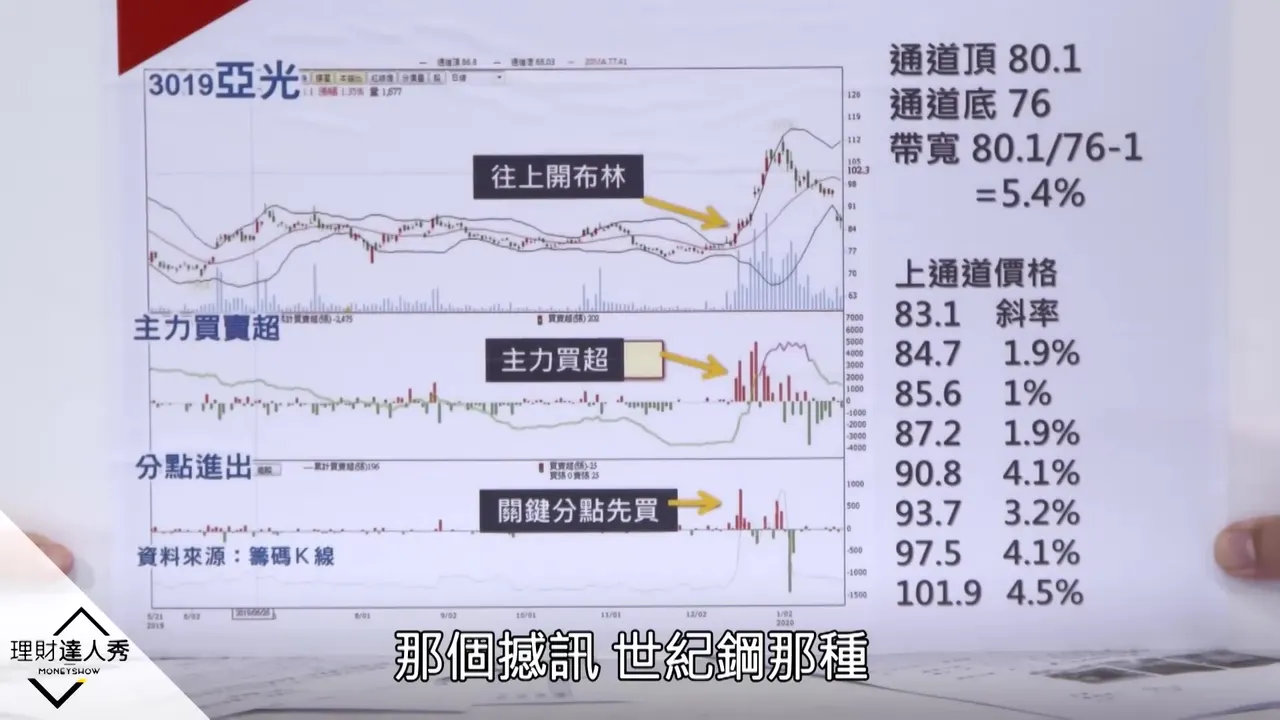
31:07Monthly-Line Uptrend Test and Sell Warnings
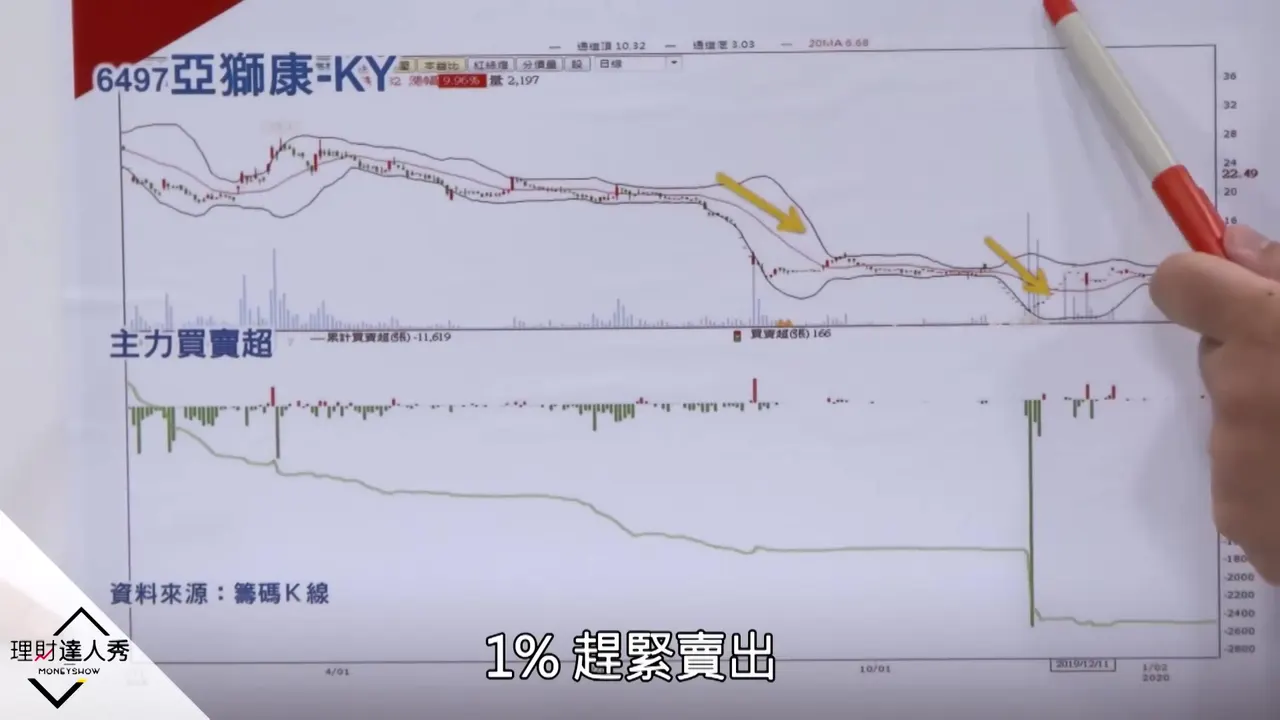
If price swings between the upper band and the monthly line without breaking below the monthly line, it is an uptrend, you no longer need to care about band width, and you can simply hold comfortably. A monthly-line slope of 0.4 or more is very nice, and 1% or more is a very strong stock. For selling, look at the major players: when they keep selling and the lower band bends down by more than 1%, sell quickly.
▶ Watch from here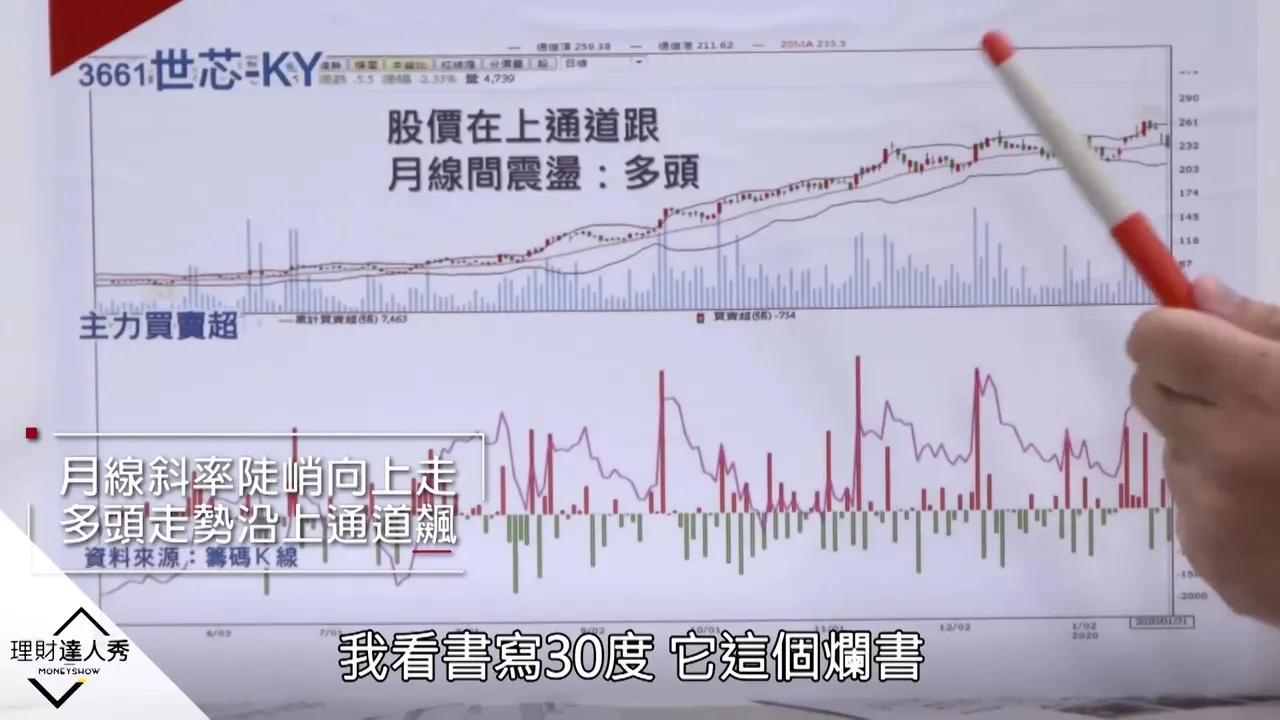
32:32Wide Band, Major-Player Net Buying: Going Long
A wide-band stock swings over a large range: the channel top is 42.1 and the channel bottom is 34.6, a 22% gap that exceeds the 20% wide-band threshold. The major players have been net buyers of this one for a long time, so you go long, and the lower band is a good buy point because they are accumulating on dips. This differs from the narrow-width idea of selling when the lower band turns down; do not confuse the two, because when the width is wide, price naturally swings widely.
▶ Watch from here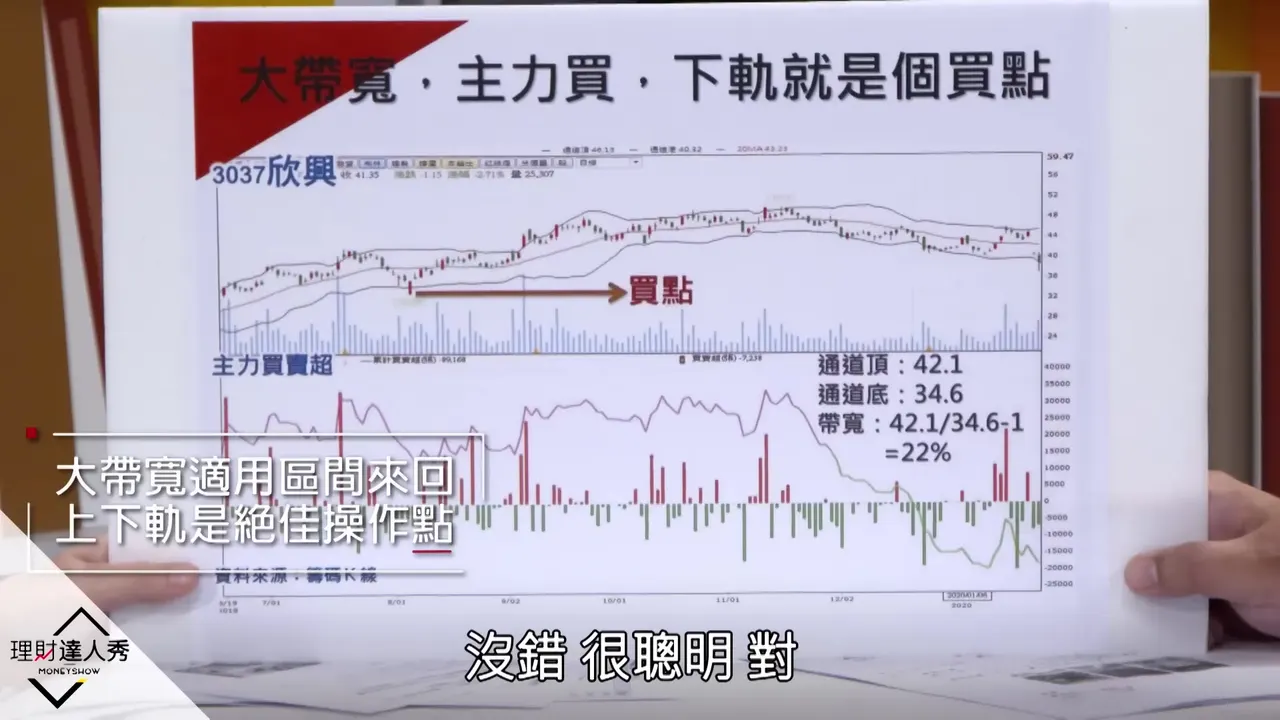
34:12Wide Band, Major-Player Net Selling: Short Example
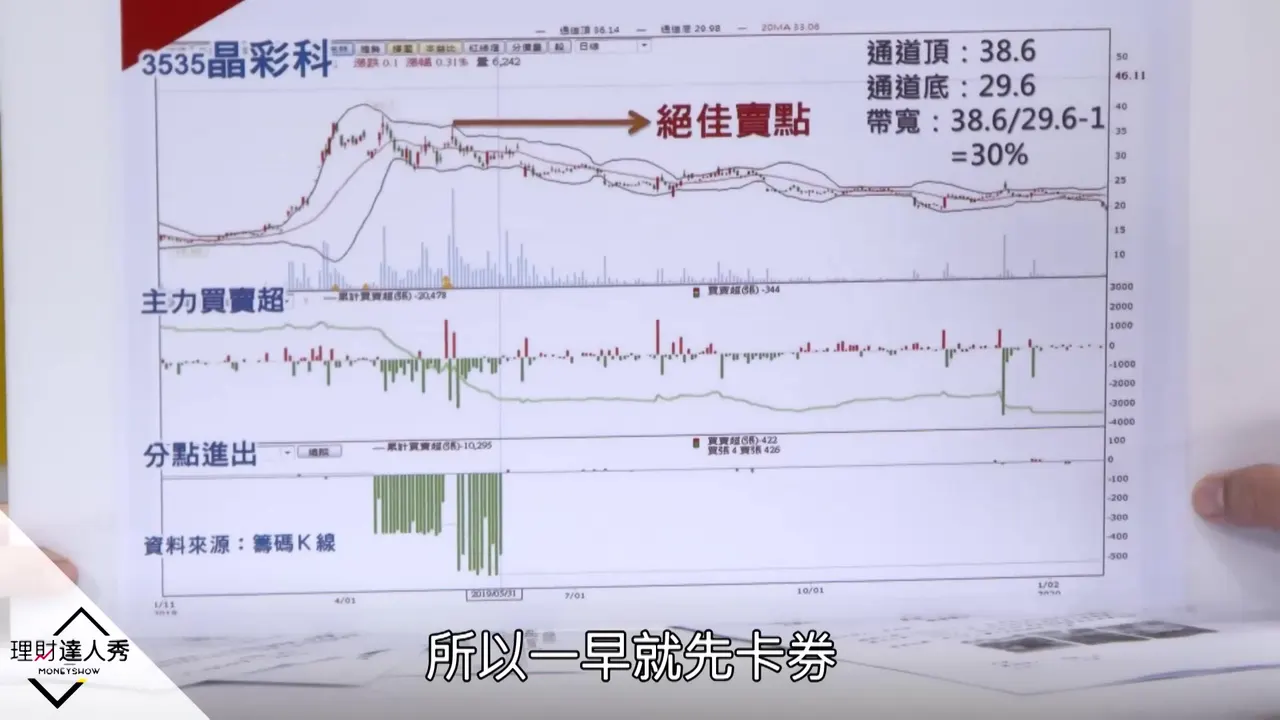
A wide band combined with major-player net selling: the channel top is 38.6 and the channel bottom is 29.6, a 30% gap, and a rise to the upper band is an excellent selling point, because the major players lifted the price 30% from the lower band in order to keep unloading shares onto retail investors; the key broker branch was selling 500 lots every day. The host already wanted to short this stock, lined up borrowed shares in advance, sold at limit-up and got filled, and it fell all the way to the lower band for a 30% gain. The conclusion is that every Bollinger approach must be paired with major-player net buying and selling, and if the major players are selling, do not enter even if the Bollinger looks bullish; major-player net selling can be checked with a free chip-flow candlestick app.
▶ Watch from here