Granville's Eight Rules, Xiaoge Edition: Telling a Rebound from a Recovery, Combined with Major Player Flows and Volume
TL;DR: Granville's eight rules are only reliable when combined with major players' net buying/selling and trading volume, because the monthly moving average's direction decides whether it is a rebound to grab and run from quickly or a recovery you can add to and hold for a swing, and relying on moving-average buy points alone may mean buying right where major players are unloading.
Key ideas
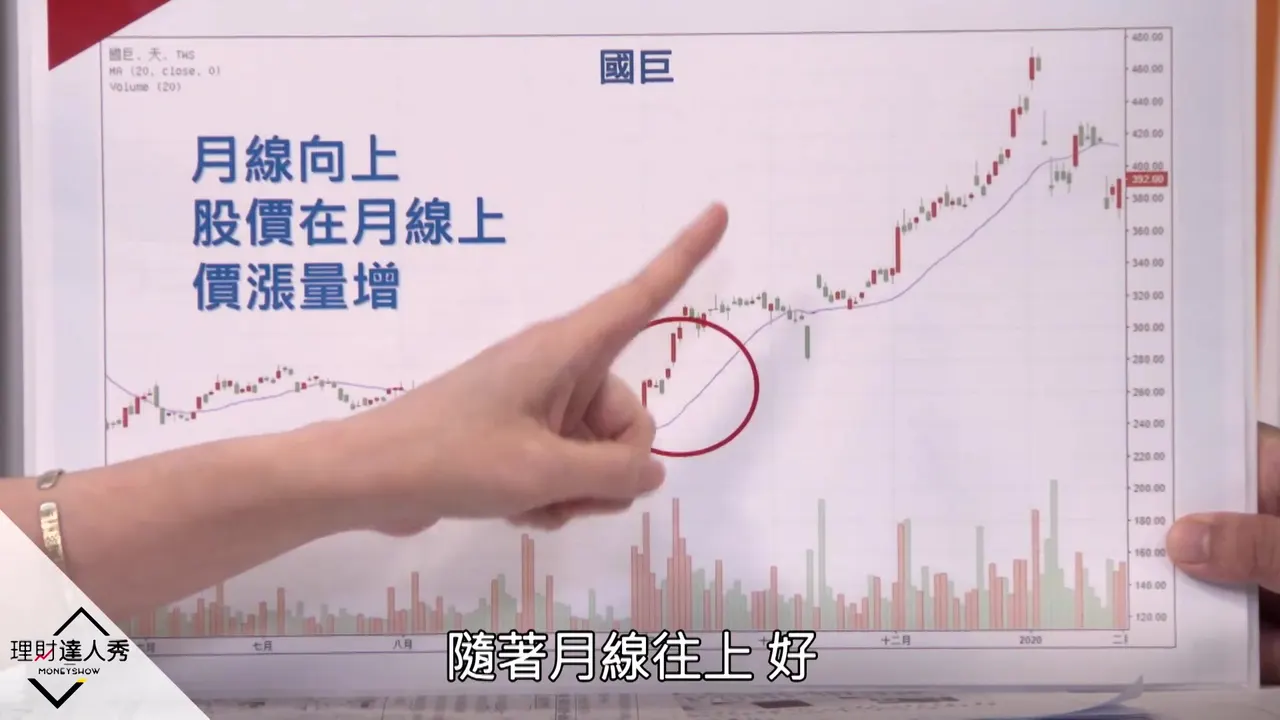
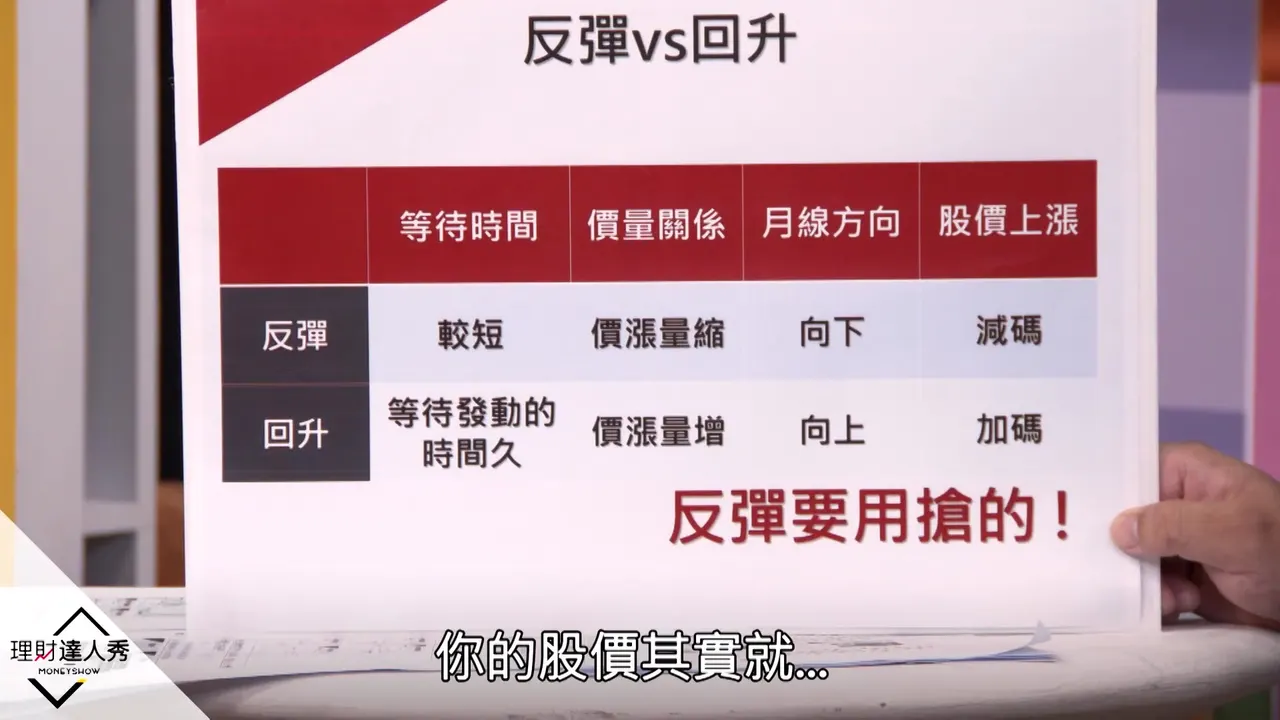
- The direction of the monthly moving average determines the nature of the move: if it points down and the price cannot get back above it, treat it as a rebound, so grab it fast and trim as it rises; if it points up, it is a recovery with rising price and volume, and you can add and ride a big swing.
- The eight rules' buy points are a breakout above, or a dip below, a rising monthly line, and a retest of the moving average that finds support; in a bear market with a very large deviation you can grab a rebound but must hedge with a short position. Sell points include breaking below a falling moving average, the "hit the head that sticks out" pattern, a falling moving average that the price cannot break above, and an excessive deviation.
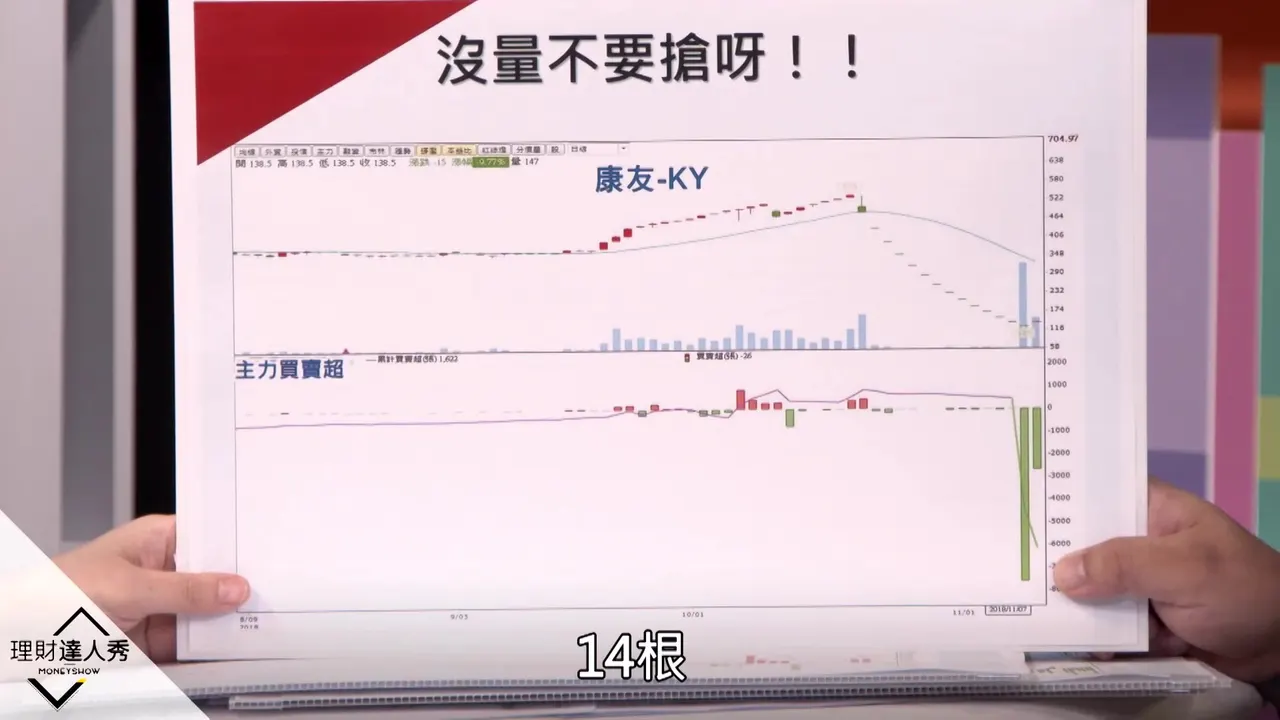
- Granville's era had no flow data or volume data, while Taiwan has the most complete flow statistics and major players move ahead of the price; even when a moving-average buy point appears, never buy if major players are selling, and a decline without volume means nobody is buying, as with Kanglin-KY falling 14 candlesticks in a row, a falling-knife example.
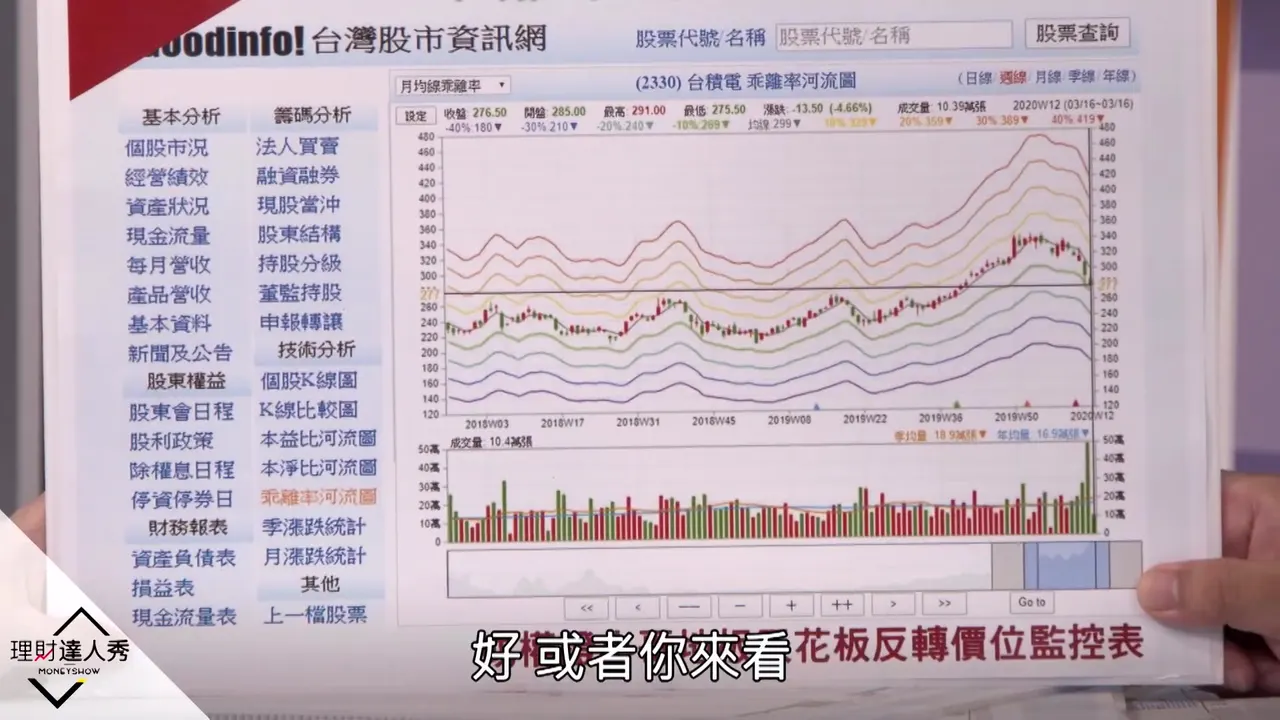
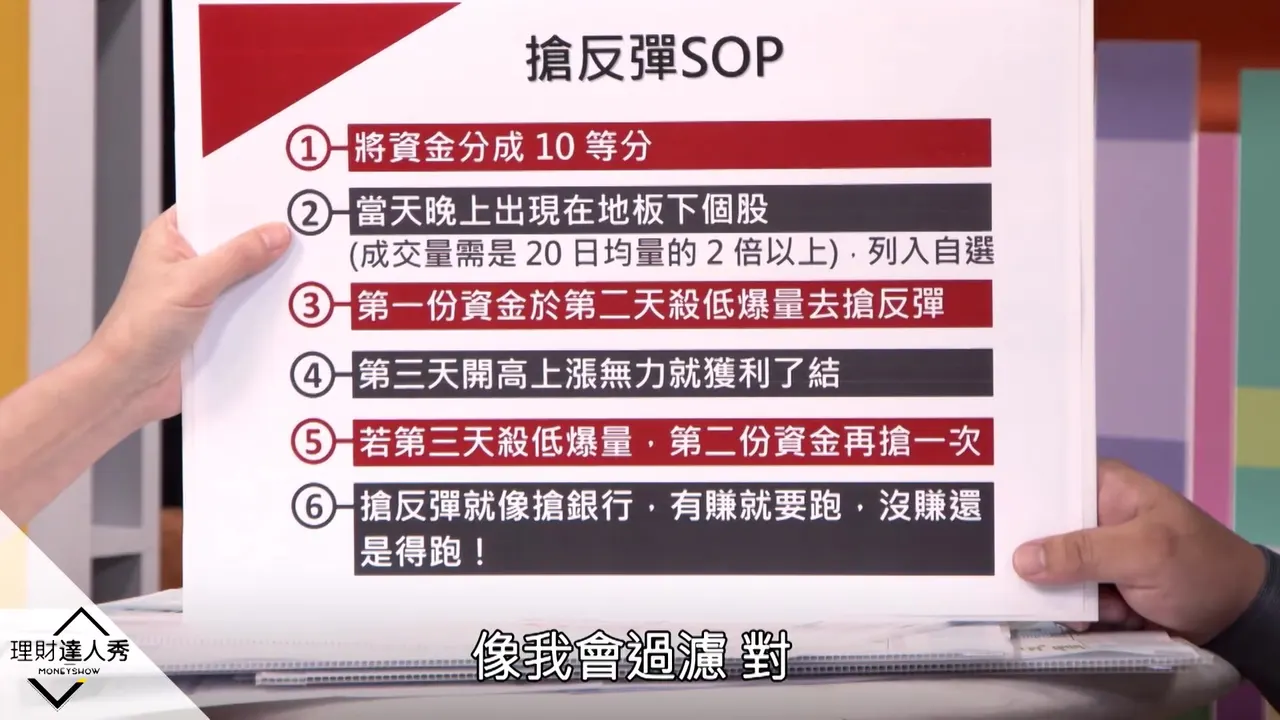
- What counts as an excessive deviation differs by stock, so the fixed numbers in books do not apply and you should use statistics to find each stock's rebound floor line; to grab a rebound you also need volume at 2 times or more the 20-day average volume, split your capital into 10 equal portions to enter and exit in stages, and cut losses if the attempt fails.
Section summaries
0:30Principles for Judging a Rebound vs. a Recovery
The opening explains that in markets with big rises and falls, the first principle for telling a rebound from a recovery is the direction of the monthly line: when it points down and the price cannot get back above it, treat it only as a rebound and do not chase; when it points up, it is a recovery, which commonly shows rising price with rising volume and falling price with shrinking volume. A table sums up the difference in handling: a rebound has a short waiting time, needs fast entry and trimming as it rises, while a recovery lets you add and ride a big swing.
▶ Watch from here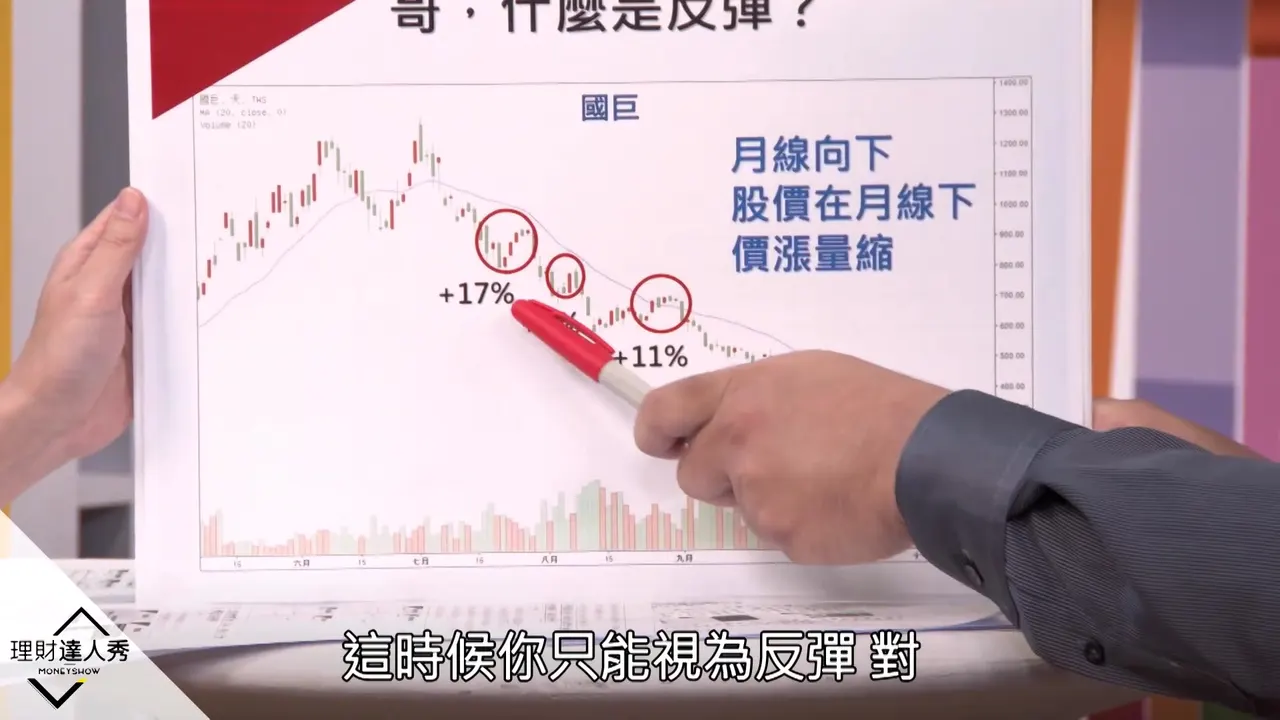
9:25Granville's Eight Rules: The Buy Points
After a joke about how the Xiaoge edition differs from the Granville charts found elsewhere, the video formally explains the buy points of the eight rules: when the monthly line points up and the price breaks above it, you can look for a point to buy; a dip below a rising monthly line is also a good buy point, because the monthly line is still rising and the trend is bullish, so rebound trades have a high win rate and are relatively safe.
▶ Watch from here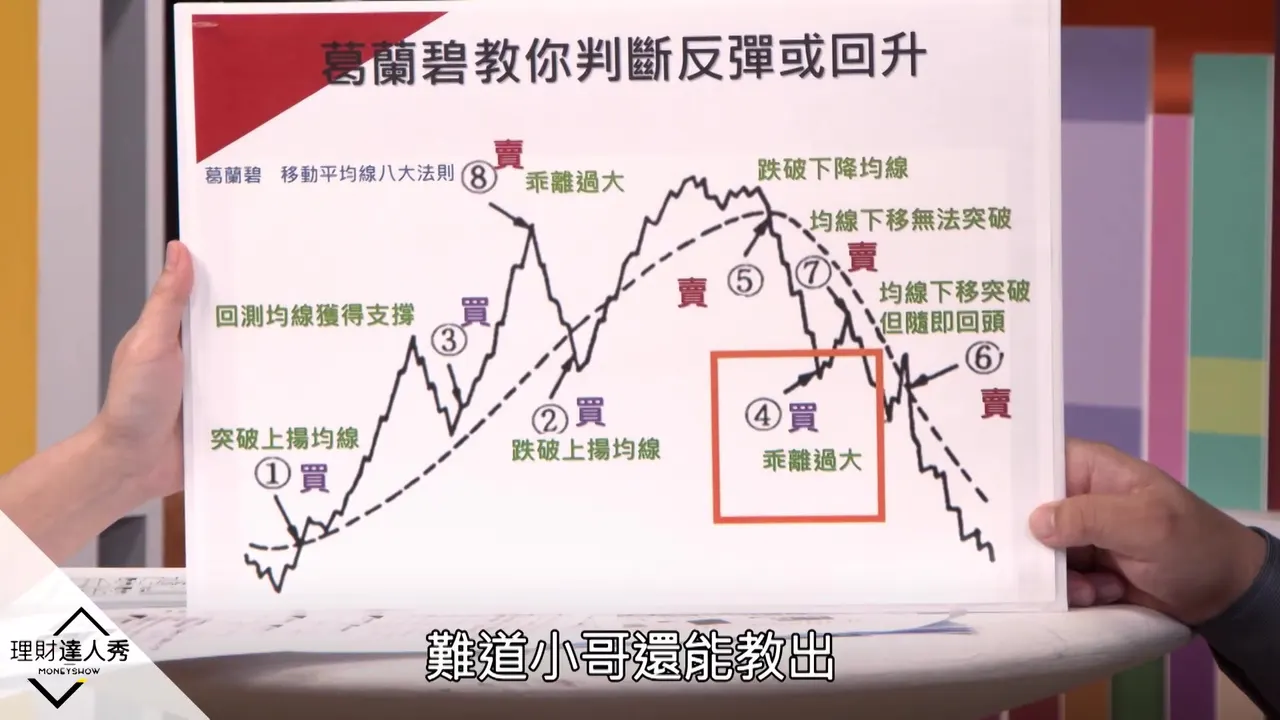
10:55Retest Support and Conditions for Short-Side Trades
The 3rd and 4th buy points are a retest of the moving average that finds support, and grabbing a rebound when the deviation is very large in a bear market, but you must hedge with a short position. The short-side conditions include breaking below a downward-curving moving average, the "hit the head that sticks out" pattern where the price pokes slightly above the monthly line while the moving average is falling, a falling moving average that the price cannot break above, and selling when the deviation is too large in a bull market. In the past, when prices had fallen too far, grabbing warrants had produced a return of 1097%, and selling the next day brought about 900-odd %.
▶ Watch from here15:31Chart-Reading Quiz and Verifying the Rules
A real chart-reading quiz verifies the eight rules: buy on a fresh breakout with the moving average rising; buy when a retest of the moving average finds support while it is still rising; sell to take profit when the deviation is very large; sell on a break below once the monthly line starts curving down; and the final strong rebound with a very large deviation is the spot to grab a rebound. The conclusion is that Granville's eight rules are easy to learn, and even plain stock trading can earn a big move.
▶ Watch from here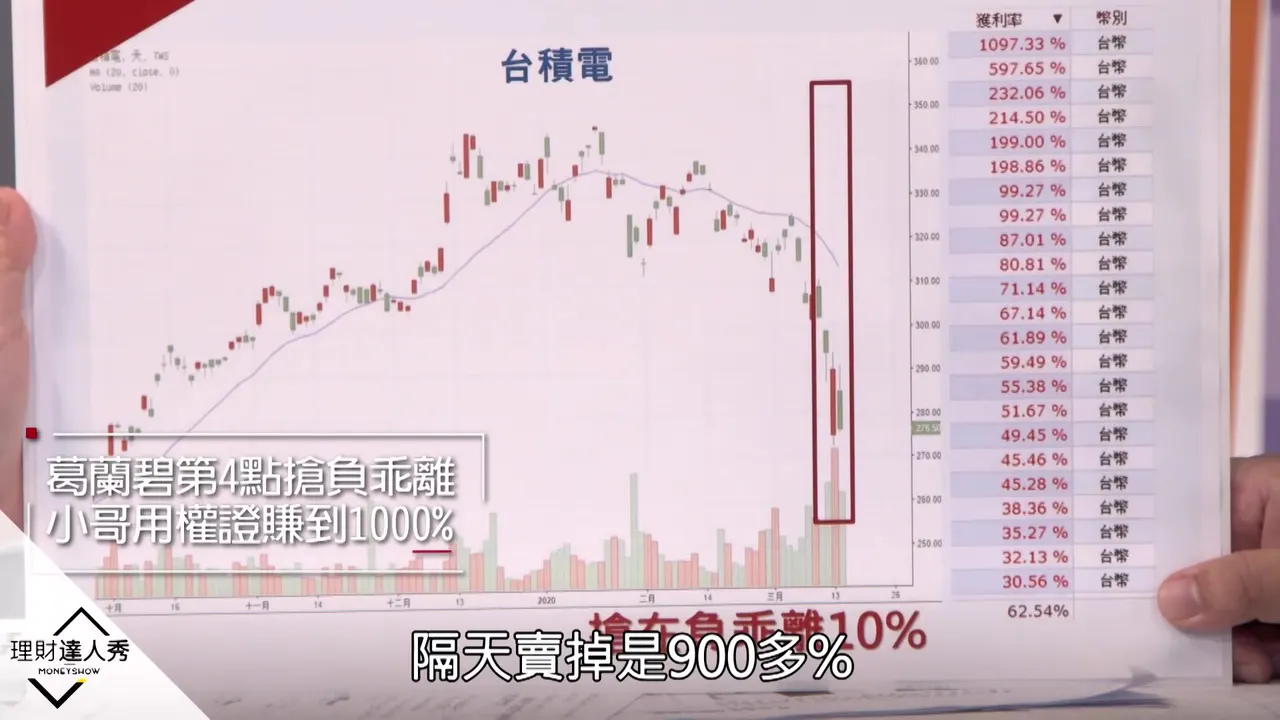
17:05The Enhanced Edition: Adding Major Player Flows
This introduces the Xiaoge enhanced version of Granville's eight rules; adding major players' net buying/selling means you will almost never go wrong. Granville was born in 1923, when tools like flow data and volume did not exist, and Taiwan's flow statistics are the most complete; major players move ahead of the price. Taking TSMC as an example, major players sold heavily first and the price fell afterward, so before shorting you should check the flows first.
▶ Watch from here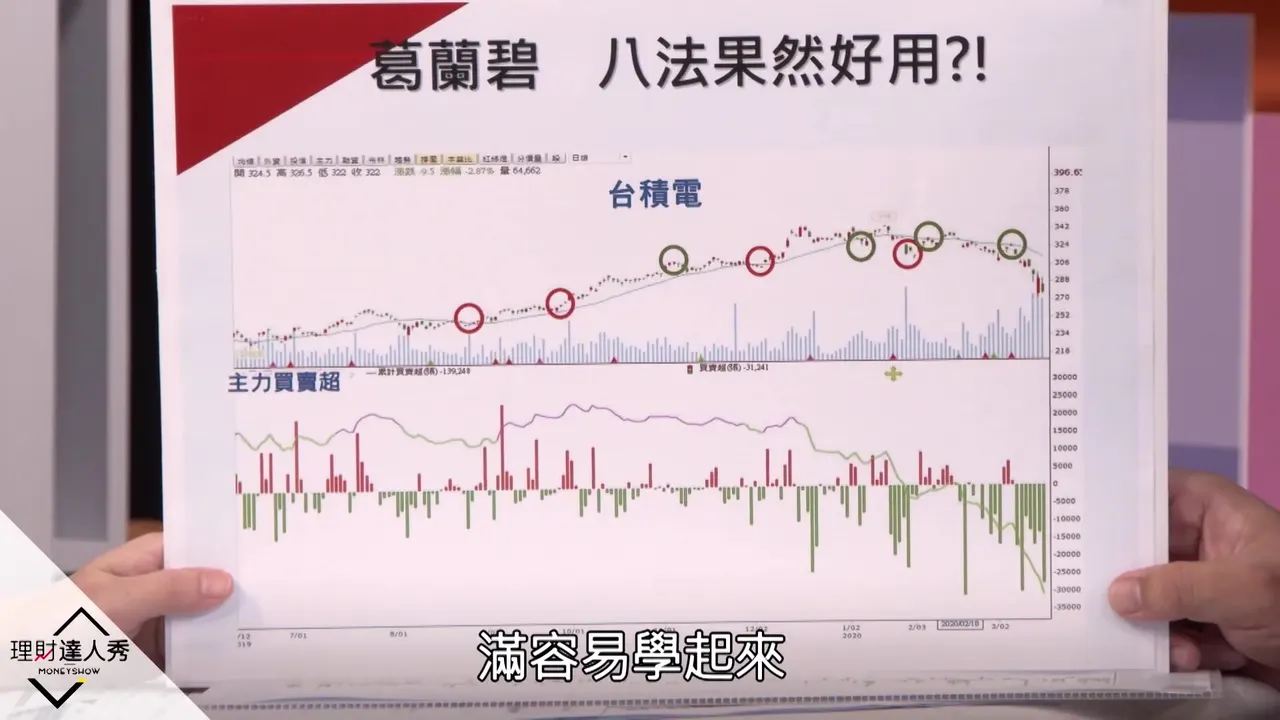
18:25Flow and Volume Examples as Warnings
This shows an example of entering purely on Granville's buy points and losing money: major players kept selling during the rise, so that spot was really a place to look for shorts, not a buy point, so when a buy point appears but major players are selling, never go in. Taking Kanglin-KY as another example, after 2 limit-up candlesticks in a row it broke down and fell 14 candlesticks in a row; the worst thing in a decline is no volume, which means nobody is buying below, and only when volume appeared did it rebound, so only that one candlestick was one to grab. When catching a falling knife you cannot look only at the price being cheap; you must look at major players' net buying/selling and the price-volume relationship together.
▶ Watch from here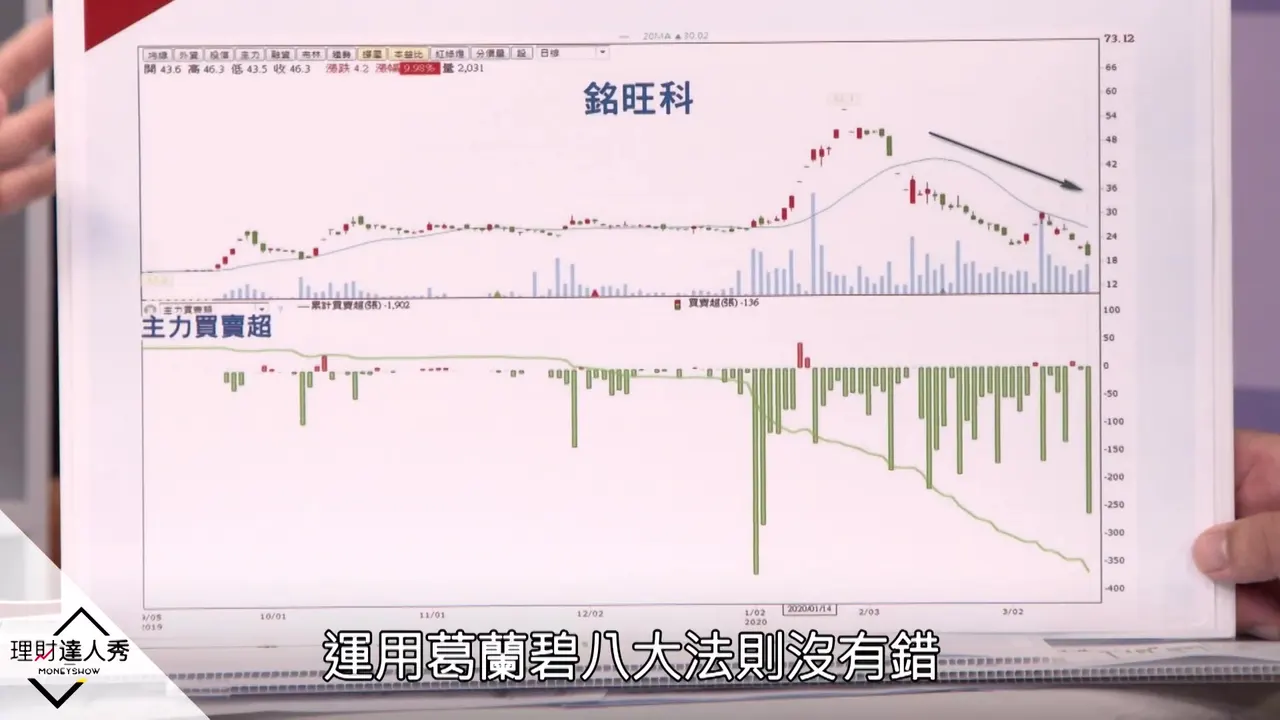
22:41Definition of Deviation and Statistical Application
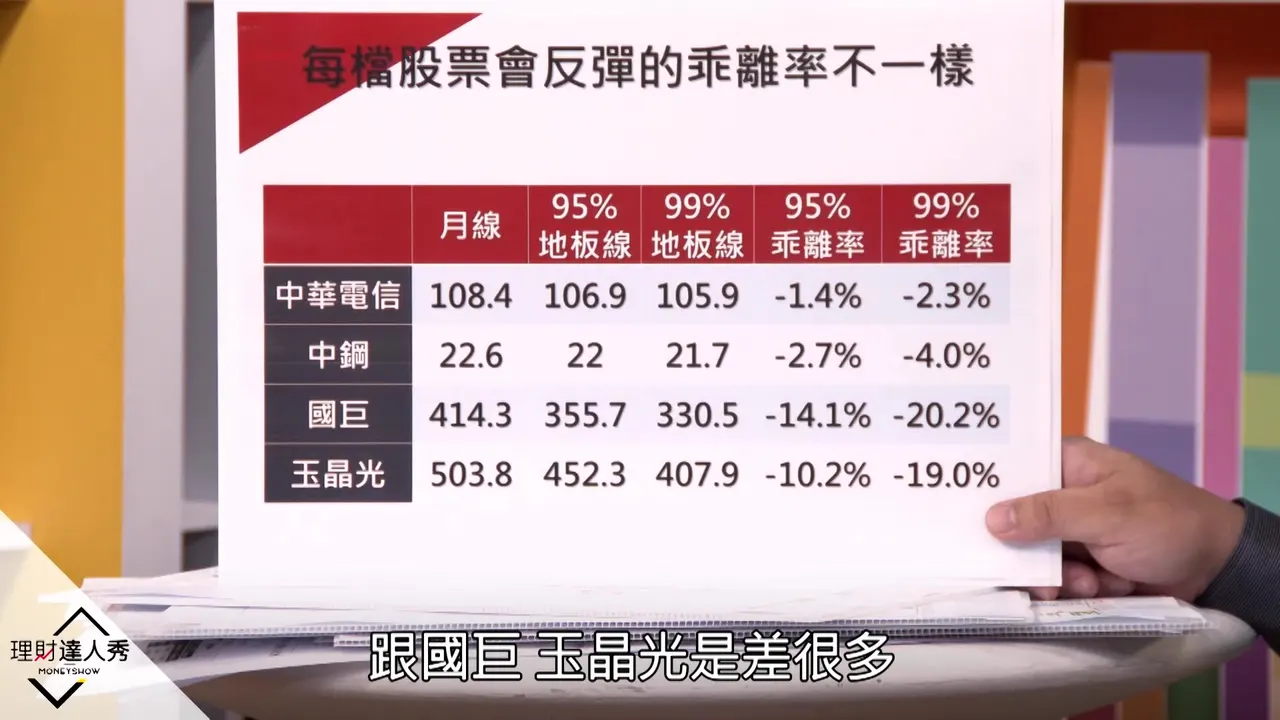
Deviation is the distance between the price and the moving average; for example, with the monthly line at 100 and the price at 90, the deviation is -10%, and the deeper the fall, the bigger the rebound. The fixed standards for excessive deviation found in books do not apply, because different stocks have different levels of liveliness, and Chunghwa Telecom and Yageo will not rebound alike; instead, use statistics to find each stock's floor line, the percentage it has historically fallen to before rebounding. The 95% floor line is 1.4% for Chunghwa Telecom, 14% for Yageo and 10% for Largan; the 99% line is 2.3% for Chunghwa Telecom, 4% for China Steel, 20% for Yageo and 19% for Largan. But you cannot rely on this table alone; you also need to combine it with volume and major player flows.
▶ Watch from here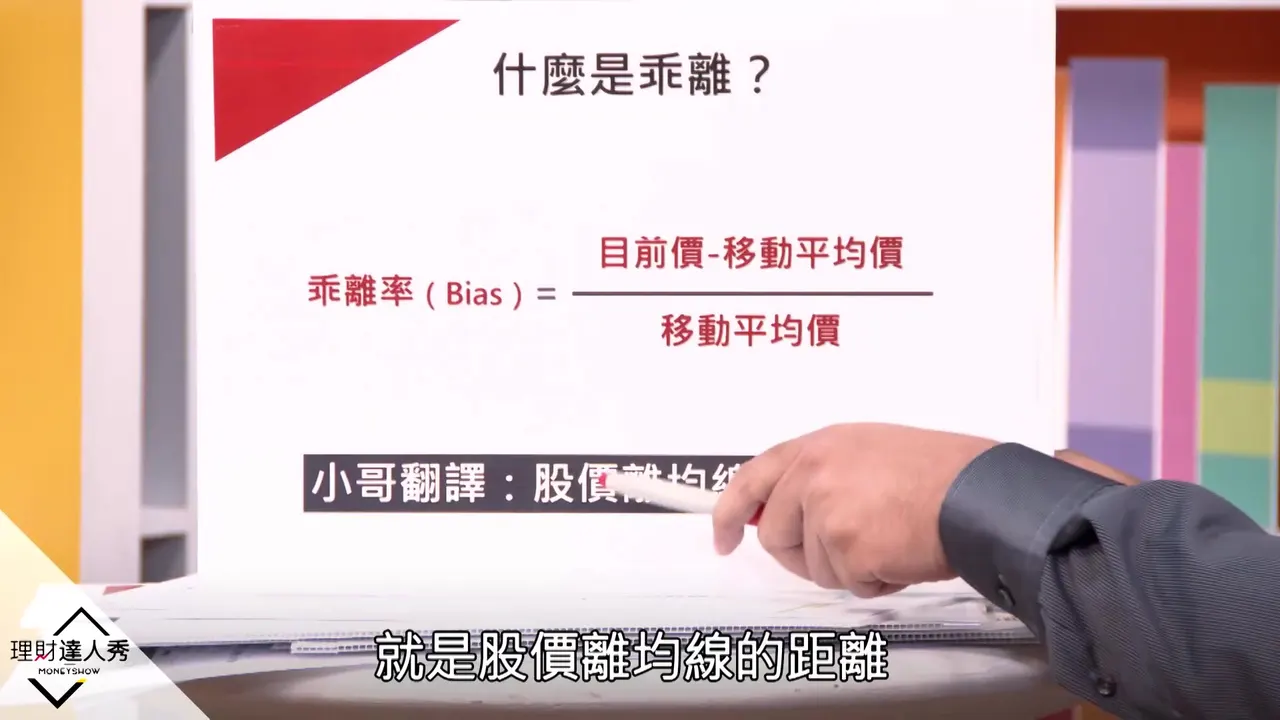
26:22Rebound-Trading SOP and Live Cases
The rebound-trading SOP: first split your usable capital into 10 equal portions, screen at night for stocks that have fallen below their floor line, and enter only when volume reaches 2 times or more the 20-day average volume; Yageo, for example, kept falling without volume, which is very dangerous. Use the 1st portion only if the 2nd day plunges to a low on heavy volume; if the 3rd day opens high but the rise lacks strength, sell some first; if the 3rd day keeps plunging, use the 2nd portion (it can be somewhat larger) to grab it again, and even when a grab fails you put in at most about 3 portions. Grabbing a rebound is like robbing a bank: if you profit, run; if you don't, you still have to run. Examples include Shunda (after volume appeared on January 7, it plunged again the next day and was grabbed, then rebounded sharply) and Meilida (the dive on February 27 made a splash, which is safer); on the major-player map, heavy buying by a broker headquartered in the stock's home area is a geographic flow signal, and this kind of geographic effect exists only south of Taipei.
▶ Watch from here